Exercise 23: Model hybrid materials with the Sandwich Panels model
Hybrid materials and structures combine the benefits of two or more materials to produce new materials that exhibit unique combinations of properties.
For example, both composite materials and sandwich panels are commonly used to create strong, lightweight structures.
-
Use the Sandwich Panels model to create synthesized records for a family
of hybrid materials
-
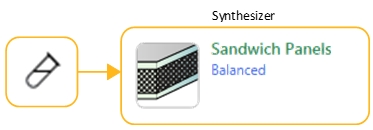
Select the Sandwich Panels – Balanced
model.
-
Select the Sandwich Panels – Balanced
model.
-
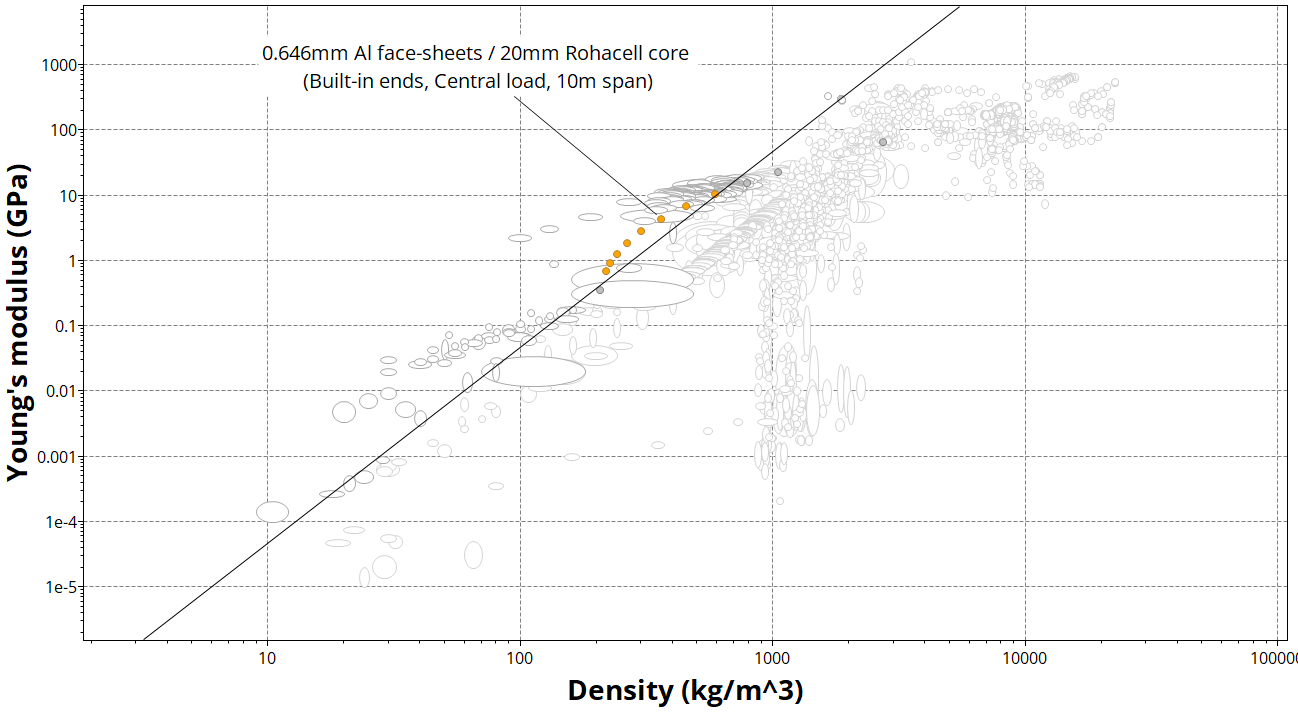
Plot an Index line corresponding to a lightweight, stiff
panel in bending: E1/3/ρ
-
Click
 Index and display
lines, enter a slope value of 3, and select
maximize the index. Click the plot area to place
the index line, then click and drag to change its position.
Index and display
lines, enter a slope value of 3, and select
maximize the index. Click the plot area to place
the index line, then click and drag to change its position.
-
Click
-
Add labels to the source records and some of the synthesized records
- You can click individual records on the chart and drag to place a label.
- You can also add labels from the Results list: select one or more records in the list, right-click and select Label on the shortcut menu, then drag the labels where you want them on the chart.
-
Click
 Highlight
synthesized records to help you identify the synthesized
records on the chart.
Highlight
synthesized records to help you identify the synthesized
records on the chart.
-
Use the Zoom controls
 and
and  to zoom in to the area of interest on the chart.
-
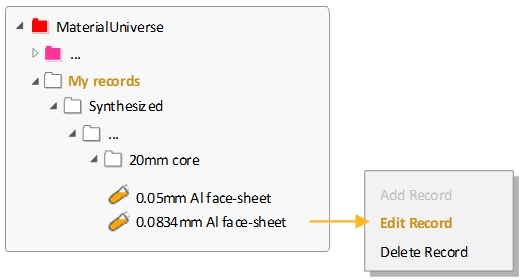
Navigate to your synthesized records in the Browse
panel
Synthesized records appear on the browse tree under My Records and may be edited or deleted in a similar way to User Defined records.