The Performance Index Finder lets you plot performance indices on a chart for a
specific design situation, without having to derive an index from first
principles.
Use performance indices on a chart by using index lines and performance
indices.
Can't find a specific performance index in the Performance Index Finder? Plot it on a
chart by creating an attribute
expression.
The performance index finder is only available for materials in
MaterialUniverse. To create a chart using the performance index
finder:
-
In the Selection Project window under Selection data,
select a MaterialUniverse data template.
-
Under Selection Stages, click
 Chart/Index.
-
Select Performance Index Finder at the top of the axis
tab.
-
Select a component from the Function and Loading
list.
The performance index equation will be displayed along side the
component notes, and whether the index should be
Minimized or
Maximized.
-
Edit the other parameters of the component, if required. They will only be
active if further settings are available.
-
If applicable, select Cyclic loading.
Cyclic loading only applies to performance indices for strength limited
designs, and should be selected when the component is subjected to a high level
(10^7 cycles) of cyclic loading. When selected, the performance index uses the
fatigue strength (at 10^7 cycles) in place of the yield strength. If cyclic
loading is not selected, then the loading condition is taken as static. In cases
where cyclic loading is always applicable, the setting will not be
visible.
-
Set the axis settings, if required.
For effective material selection charts, there are three main types of charts
that the performance index finder can be used to create:
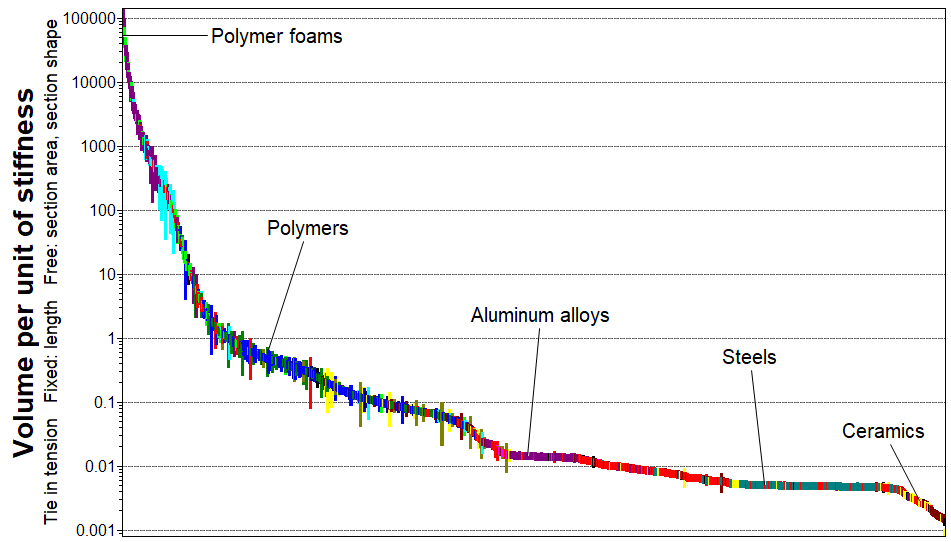
A bar chart, to rank the materials based on the performance index
value.
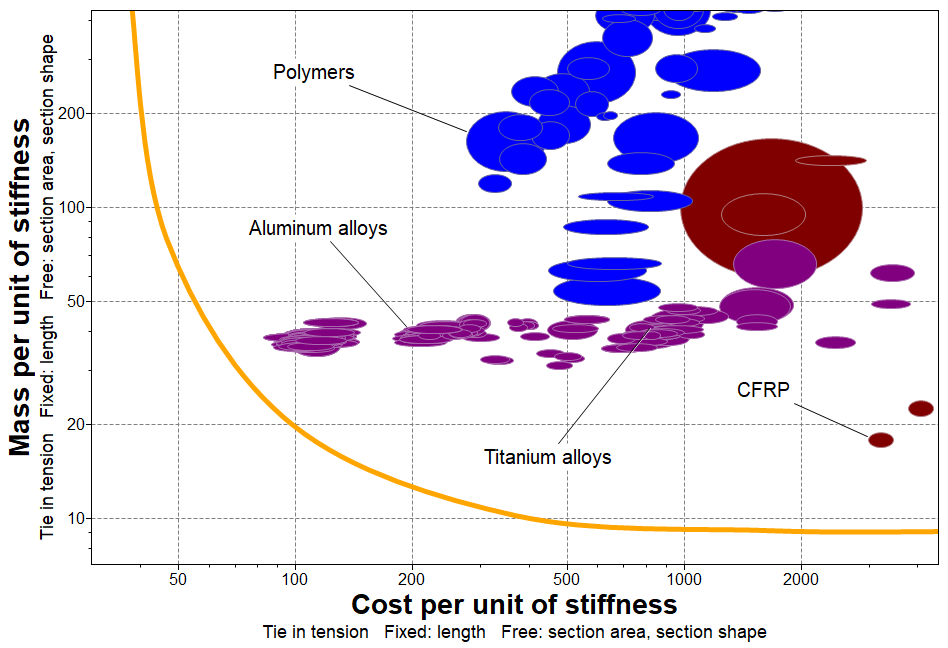
A trade-off curve,
by plotting two different properties with the same limiting constraint.
For example, plot mass per unit of stiffness vs. cost per unit of
stiffness.
A coupling line
chart, by plotting the same material property with two different
constraints, and identify the method by which the materials are likely
to fail first. For example, plot mass per unit of strength vs. mass per
unit of stiffness.

- Optional:
To view the expression for a performance index:
Warning: If you follow these instructions, you must use
Cancel to exit both dialogs in order to keep the
chart axis unchanged.
-
In Chart Settings ,click either the
X-Axis or Y-Axis
tab.
-
Select Single or Advanced Property.
-
In the Property Definition section, click
Advanced.


