Creating trade-off curves

Plot performance indices on a chart and add a trade-off curve to identify optimal materials.

To create a trade-off curve:

  1. Identify the two conflicting objectives.
    For the bicycle example above, the two objectives are to minimize mass and to minimize cost, with a stiffness-limited design.
  2. Calculate the two performance indices associated with these objectives.
    • Either derive the indices from first principles, use the performance index finder, or consult a table of commonly-used indices.
    • The bicycle frame is modeled as a stiffness-limited beam in bending, with a free sectional area.
      • The performance index to minimize for minimum cost: M1 = Cm ρ / E1/2.
      • The performance index to minimize for minimum mass: M2 = ρ / E1/2.
      • Cm = material cost per unit mass, ρ = density, E = Young’s modulus (N.B. Flexural modulus can be substituted by Young’s modulus for some materials, and they are assumed here to be the same).
  3. Create a chart with M1 on the x-axis and M2 on the y-axis.
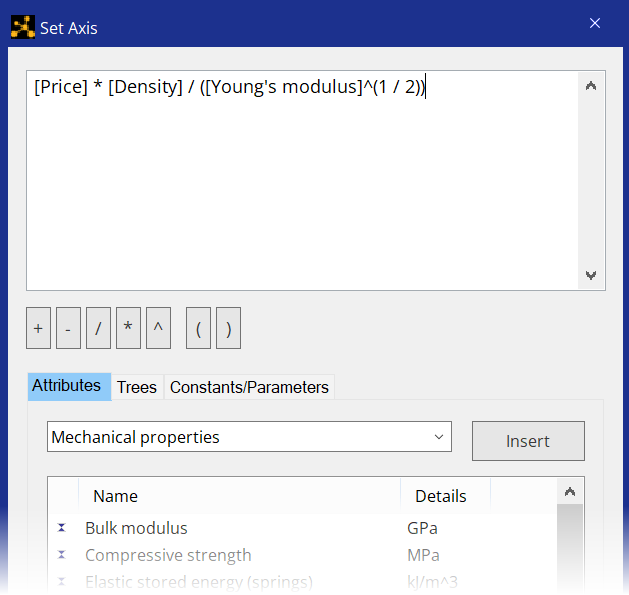
    1. Performance indices can be plotted on a chart axis by building an attribute expression. On the axis tab in the Chart Stage Settings dialog, click Advanced.
    2. Create an expression for the performance index from the list of attributes.
  4. Create a trade-off curve on the chart.
    1. Click Curve on the chart stage toolbar.
    2. Click the chart where you want the curve to start.
    3. Click other positions on the chart to create more points.
    4. To finish drawing the curve, press Enter, or double-click the final point.
  5. Drag the curve to adjust the position of it if necessary.