


Creating a coupling line chart
Plot a coupling line on a chart to identify failure modes during material selection.
Before creating the chart, identify what the limiting constraints and material indices are:
-
Derive material indices for the constraints.
-
Compressive fracture will occur if the stress, sigma, in the rod
exceeds the compression strength, σc, of the material. To avoid failure
requires

-
Remove the free variable t (wall thickness) from the objective
equation, by substituting for t using the equation for
compressive failure. This gives the equation for minimizing rod mass:

The first performance index to minimize is:

-
The constraint that the rod does not fail by buckling requires a mass
of:
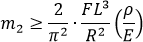 where E is the Young’s modulus.
The second performance index to minimize is:
where E is the Young’s modulus.
The second performance index to minimize is:
-
Compressive fracture will occur if the stress, sigma, in the rod
exceeds the compression strength, σc, of the material. To avoid failure
requires
-
Derive a coupling equation that connects the two indices.
The selection that meets both criteria is found by equating the two expressions for mass to produce a coupling equation:
m2 = m1
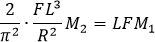
The coupling equation is therefore:

with a coupling constant of:

Taking logs of both sides of the coupling equation, produces: log M2 = log M1 + log Cc. This is an equation in the form y = m x + c.
These equations can now be used to create a coupling line
chart:
-
Create a display line, and position it so that it goes through a certain
point:
- Calculate the value of the coupling constant Cc based on the fixed variables. For example, for an L/R ratio of 30, Cc = 5.5 (NB. Young’s modulus has units of GPa and compression strength has units of MPa in Granta Selector).
- Pick an arbitrary numeric value for M1, and use the coupling equation to calculate what the corresponding M2 value would be.
-
Click
 Index
line and create a display line of slope 1.
Index
line and create a display line of slope 1.
- Right-click the display line and change the properties so that the line passes through the point of the specific values of M1 and M2 calculated above.