Plotting a performance index on a chart
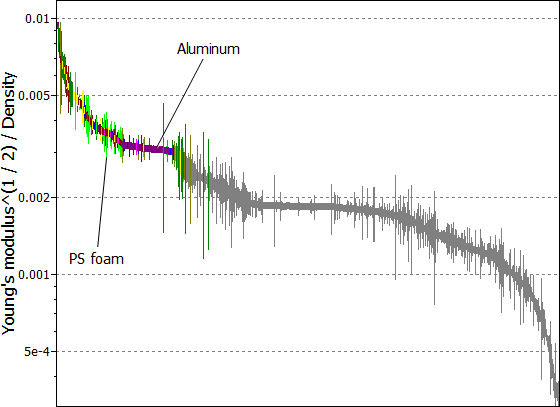
Performance indices can be plotted using either an index line, or by plotting a combined property on one axis (for example, E1/3/ρ).
There are two ways a performance index can be plotted on a chart:
- As a combined property on one axis of a chart
 Tip: To plot a specific performance index as a combined property on just one axis of a chart, click Advanced... in the chart stage window and type in the index equation. For example:
For a low mass, stiffness-limited, panel in bending (performance index = E1/3/ρ), type in: [Young's modulus]^(1/3)/[Density]
This technique is used by the Using Performance Indices, which enables you to quickly identify and plot performance indices, and removes the need to look up or derive performance indices.
- Using an index line
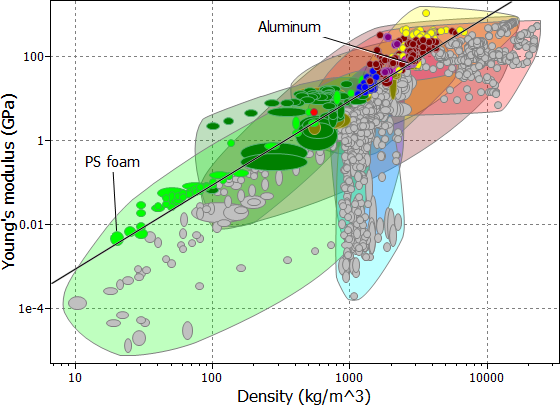
To plot a performance index using an index line:
-
Click
 Index line on the chart toolbar.
Enter a slope value of 3, select Maximize the
index, and click OK.
Index line on the chart toolbar.
Enter a slope value of 3, select Maximize the
index, and click OK.
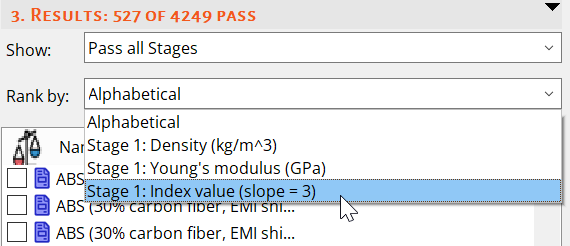
- Optional:
To find the optimal material (the one with the highest value of the performance
index), rank the results by Stage 1: Index value
(slope=3) in the Results pane.
By default this list will be ordered from high to low.