Material selection: graphical method
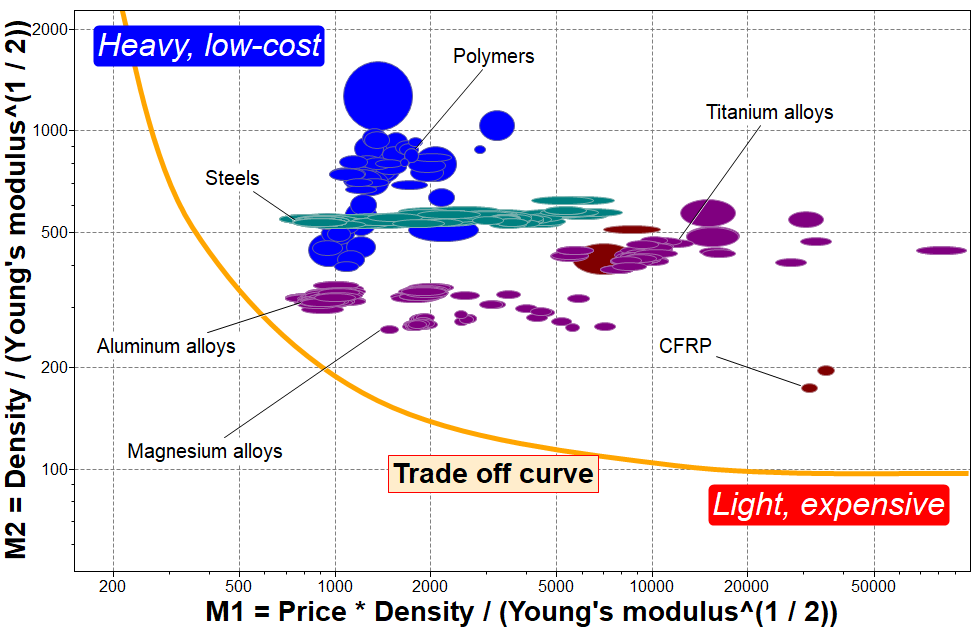
The trade-off curve is a visual annotation to the chart. All the materials that lie along the trade-off curve are potential candidates.
This is because there are no other materials that have lower values of both M1 and M2. These materials are known as non-dominated solutions. The final choice of material will depend on the relative importance of the two objectives.
Materials that lie within the trade-off curve, such as stainless steel, are dominated solutions. These materials are sub-optimal, as there are other materials with lower values of M1 and/or M2.