


Trade-off curves
A trade-off curve is used to identify optimal materials in designs where there are conflicting objectives (for example, minimizing both cost and mass) and one limiting constraint (for example, stiffness-limited design, or strength-limited design).
The final material choice is often a compromise.
An example trade-off curve for selecting materials for a bicycle is shown below. This is a stiffness-limited design, with two conflicting objectives: to minimize cost, and minimize mass. The free variable is the cross-sectional area.
The performance indices for the two objectives are plotted on the chart axes. For trade-off curves, the convention is to invert the performance indices if necessary so that the objectives are optimized when the indices (M1 and M2) are minimized.
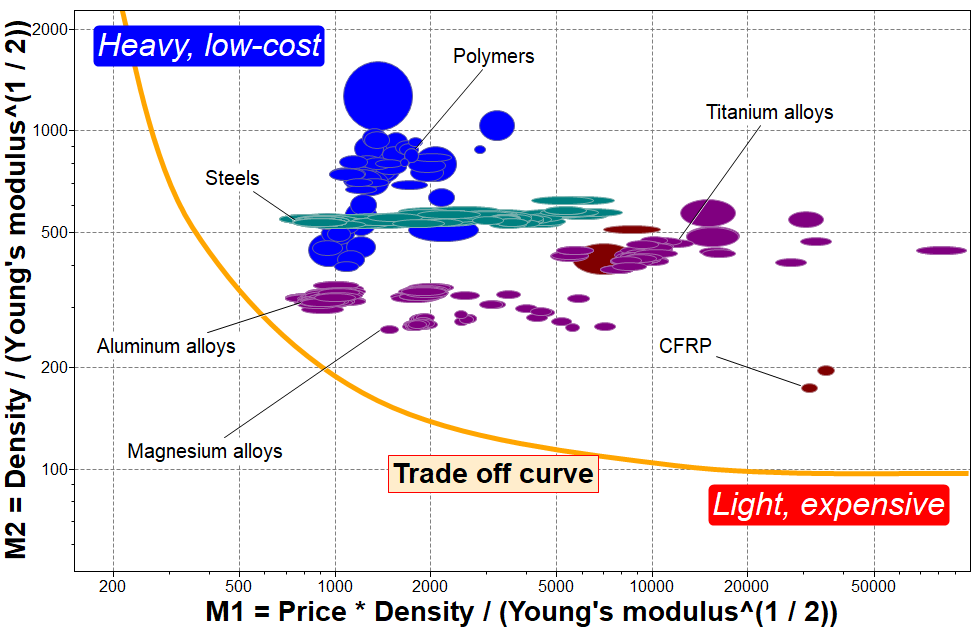
Ideal materials that optimize both objectives would be located in the bottom left corner of the chart. As there is no obvious optimum material, a trade-off curve can be used to help visualize which material best matches the objectives.
All materials that lie along the trade-off curve are candidate materials. Materials at the ends of the curve satisfy one of the objectives at the expense of the other. For example, CFRP (carbon fiber reinforced polymer) is low mass but high cost, whereas steel is low cost but high mass. Between the two extremes are materials, such as aluminum and magnesium alloys, that offer a compromise between the two objectives.
The final material choice will depend on the end application, or user of the product, and the relative importance of each objective. For example, a professional racing cyclist would be interested in a bicycle to maximize performance, and would therefore select a composite bicycle in order to minimize mass. Alternatively, a consumer who wants a children’s bicycle would probably opt for a cheaper but ultimately heavier bicycle made from steel.