Y Markers in stacked XY plots
Y markers allow for easy analysis and comparison of curves at a particular y-coordinate. Y markers can be used to compare stacked curves.
Creating Y Markers in Stacked Plots
There are two ways to create Y markers in stacked plots. You can create a Y marker for a particular stack or for all stacks. Right-click any stack to open the following menu:
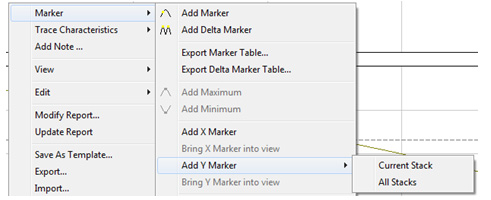
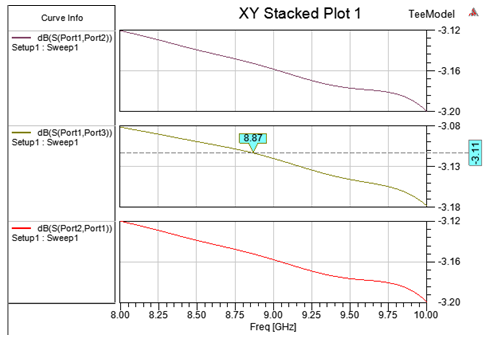
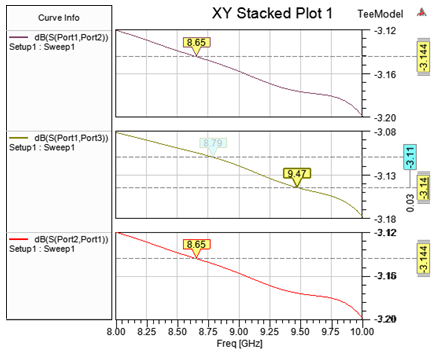
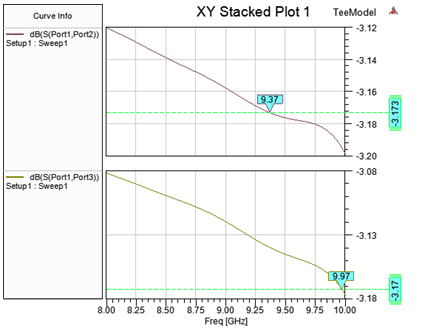
Add Y Marker > Current Stack creates a Y marker for the selected stack. The following figure shows that a Y marker was added to the second stack only:
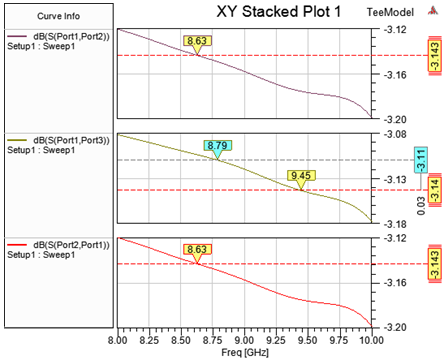
Add Y Marker > All Stacks creates one Y marker in each stack with the same value. Initially this value is the minimum Y value of the Y ranges in all the stacks. This is shown is the figure below:
Notice that the Y marker for all stacks has a different appearance than the Y marker for a particular stack; it has double parallel lines above and below the Y marker text box.
Synchronized Y Markers
All the "same" Y markers for all stacks are synchronized; that is, if one Y marker is dragged or its value is changed, all the "same" Y markers in all the stacks will also change their position. The following figure shows that when a Y marker in the bottom stack was dragged, the Y marker in top stacks moved as well:
Also, if a property of any one Y marker is changed, all the "same" Y markers show the change in property as well. For example, the following figure shows that when the line color of a Y marker in the top stack was changed to a red color, a Y marker in the bottom stack shows the same line color as well:
Automatic Y Markers for the new stack
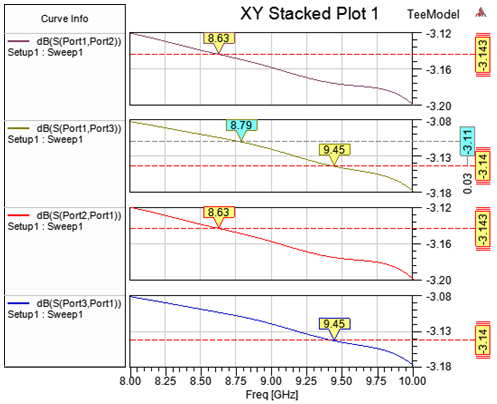
When a new curve is added to the plot, it gets all the Y markers for all stacks in other stacks, excluding the Y marker for particular stacks. The following figure shows that when the new curve "dB(S(Port3, Port1)" was added, a Y marker was added to it with value -3.14 and it has all the same properties as other "same" Y markers in other stacks:
Y Marker Delta Annotations
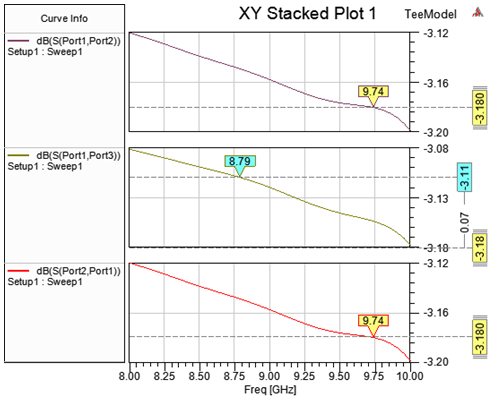
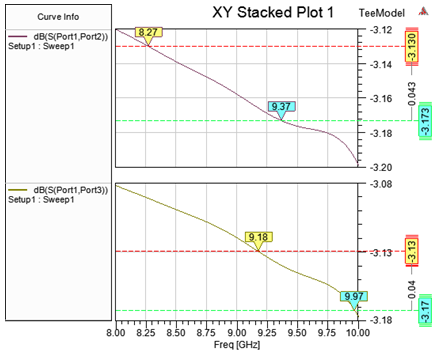
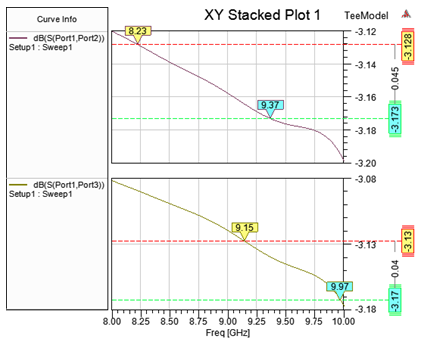
When two more Y markers are present in a stacked eye diagram, then delta annotations are shown between a pair of adjacent Y markers in all the stacks, as shown in the following figure:
Deleting a Y Marker
To delete a Y marker, select a Y marker in any stack and press Delete. This action will also delete all the corresponding Y markers in all the stacks. For example, when the Y marker with value -3.13 (red Y marker) was deleted from the bottom-most stack, all of the corresponding Y markers were also deleted:
Note that on deleting a stack, Y markers in other stacks are not affected.
Converting Rectangular XY Plot to Rectangular Stacked XY Plot
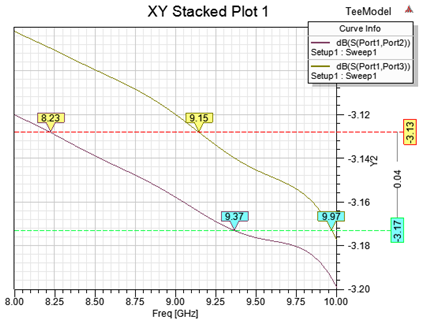
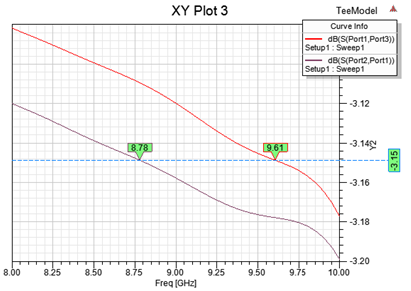
The following figure shows a rectangular XY plot with two curves and a Y marker with value -3.15 (blue Y marker):
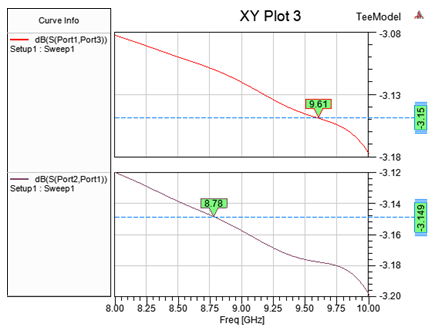
If you change the Display Type property of this plot to Rectangular Stacked Plot, then a rectangular stacked XY plot is created with each curve in its own stack and a Y marker is shown in each stack with value -3.15 (blue Y marker):
Similarly when you change a rectangular stacked XY plot to a rectangular XY plot, then all the "same" Y markers in all the stacks are shown as a single Y marker in the rectangular XY plot as shown in following figures:
The rectangular stacked XY plot in the previous figure, when converted to rectangular XY plot, looks like the following figure: