
Adding Data Markers to Traces
Select Report 2D > Marker to add markers to traces.
A marker appears as mN at the marked point, where N increments from 1 as you place additional markers. Each marker can be selected and has editable properties including name, font, background, and color.
As you place markers, one or more marker legends may appear, depending on the View > Active View Visibility settings for the legends. The main marker legend appears in the upper-left of the plot, and lists the marker names and their X and Y values in a table.
You can control the number format for the table values with the Properties dialog box, General tab. Under Marker/Other Number format, you can specify field width, precision, and whether to use scientific notation. This value is independent of the Axis tab number properties. A separate marker legend appears for delta markers, as described for the Delta Marker command.
When you enter marker mode, the cursor arrow is accompanied by an m while a circle on the selected trace shows the current position for a potential marker.
To end marker mode, right-click and select End Marker Mode or press Esc.
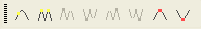
The available marker mode commands and associated icons are:
- Add Marker
 – Place a marker at an arbitrary point on a selected trace.
- Add Delta Marker
 – Enter
delta marker mode, placing a circle on the selected trace. Click the trace to set an initial point; subsequent clicks on arbitrary points
on the trace place additional markers until you leave marker mode. These
markers have their own legend, which includes the following information
for each pair of markers specified:
– Enter
delta marker mode, placing a circle on the selected trace. Click the trace to set an initial point; subsequent clicks on arbitrary points
on the trace place additional markers until you leave marker mode. These
markers have their own legend, which includes the following information
for each pair of markers specified: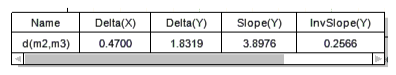
- Export Marker Table – Export the marker table data as a CSV or TAB file.
- Export Delta Marker Table – Export the delta marker table data as a CSV or TAB file.
- Add Maximum
 – Place a
marker at the maximum value on the selected trace.
– Place a
marker at the maximum value on the selected trace.
- Add Minimum
 – Place a
marker at the minimum value on the selected trace.
– Place a
marker at the minimum value on the selected trace.
- X Marker – Add up to 10 movable markers at the origin of the plot with a vertical line rising from the X-axis. Each added marker has its own color and editable properties. You can change the X marker value either by dragging or editing the X marker property Xvalue. To move an X marker, click the X label and drag it to the desired location. The label at the bottom of the line gives the X coordinate, and flag on the vertical line identifies the Y coordinate on the trace. A Lock Drag trace property lets you lock the drag feature to leave the marker in place. If more than one X marker is present, marker properties include a dimension line between adjacent markers that displays the magnitude of the delta X value between the markers. Select Clear All to remove the X markers. Bring X Marker into view – Select from a list of existing X markers to bring into view. This command is enabled if an X marker is not visible in the plot.
- Y Marker – Add up to 10 movable markers at the origin of the plot with a horizontal line extending from the Y-axis. Each added marker has its own color and editable properties. You can change the Y marker value either by dragging or editing the Y marker property Y value. To move a Y marker, click the Y label and drag it to the desired location. The label at the left of the line gives the Y coordinate, and a flag on the horizontal line identifies the Y coordinate on the trace. A Lock Drag trace property lets you lock the drag feature to leave the marker in place. If more than one Y marker is present, marker properties include a connecting line between adjacent markers and the delta Y value between the markers. If more than one Y marker is present, marker properties include a dimension line between adjacent markers that displays the magnitude of the delta Y value between the markers. The Y markers are cleared by the Clear All command. For more detail on Y markers and their use, see Y Markers in stacked XY plots.
- Bring Y Marker into view – Select from a list of existing Y markers to bring into view. This command is enabled if a Y marker is not visible in the plot.
- Next Peak
 – Move a
selected marker on the next peak on a trace. You must exit marker mode
and select a marker to enable this command.
– Move a
selected marker on the next peak on a trace. You must exit marker mode
and select a marker to enable this command.
- Next Minimum
 – Move a
selected marker to the next minimum on a selected trace. You must exit
marker mode and select a marker to enable this command.
– Move a
selected marker to the next minimum on a selected trace. You must exit
marker mode and select a marker to enable this command.
- Previous Peak
 – Move a
selected marker on the previous peak on a selected trace. You must exit
marker mode and select a marker to enable this command.
– Move a
selected marker on the previous peak on a selected trace. You must exit
marker mode and select a marker to enable this command.
- Previous Minimum
 – Place a
marker on the previous minimum on a selected trace. You must exit marker
mode and select a marker to enable this command.
– Place a
marker on the previous minimum on a selected trace. You must exit marker
mode and select a marker to enable this command.
- Go to Start (Right arrow) – Move a selected trace marker to the first data point. Enabled by leaving marker mode and selecting a marker.
- Go to Previous (Left arrow) – Move a selected trace marker to the previous data point.
- Go to Next – Move a selected trace marker to the next data point.
- Go to End – Move a selected trace marker to the last data point.
- Next Curve – Select the next curve in the report, based on the order in the trace legend.
- Previous Curve – Select the previous curve in the report, based on the order in the trace legend.
- Clear All – Clear all markers on a report.