
Viewing Near Field Results in SIwave
To view near field results:
- Click Results.
- From the SIwave area, select Near Field > [Simulation Name].

You can also access this menu by right-clicking [Simulation Name] in the Results window.
Plot options include:
- Plot Fields
- Plot Fields at Frequency
To plot fields:
- Click Plot Fields.
- Select your appropriate options:
- Field Quantity to Plot – select either |E| or |H| to plot that entire solution magnitude range.
- Plot Range – use the Max and Min fields to restrict the plot scale to a sub-range. Areas where field magnitude is above the maximum value are drawn in red. Areas where field magnitude is below the minimum value are drawn in blue. Click Apply to apply the changes or Restore to revert them.
- Face Visibility – use the check boxes to determine E/H field visibility. Choose whether E/H fields on the Top, Bottom, and Sides are visible. When you move the cursor across a visible top or bottom face, a tool tip displays the E/H field value. If both the top and bottom faces are visible, the tool tip displays the value of the top face.
- Direction to Plot – choose mag, x, y, or z plot. Mag is the default.
- Plot Scale – choose between Linear and Logarithmic scale.
- Plot Opacity – use the slider to increase or decrease the transparency of the object. Click Apply to apply changes.
The Near Field Sweep results window appears.

The Max. Field Plot displays at the bottom of the window. Use the mag, x, y, and z check boxes to view those plots.
Click Export to Electronics Desktop to export and open the plot in Ansys Electronics Desktop.
To plot fields at a specific frequency:
- Click Plot Fields at Frequency.
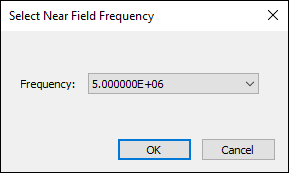
- The Select Near Field Frequency window appears.
- Use the drop-down menu to select a frequency.
- Click OK.
The Near Field Sweep results window appears, with only the selected frequency displayed.

From here, you can export the near fields animation.
From the Near Field results menu, you can also access additional Near Fields options.