
Changing Plot Display Options
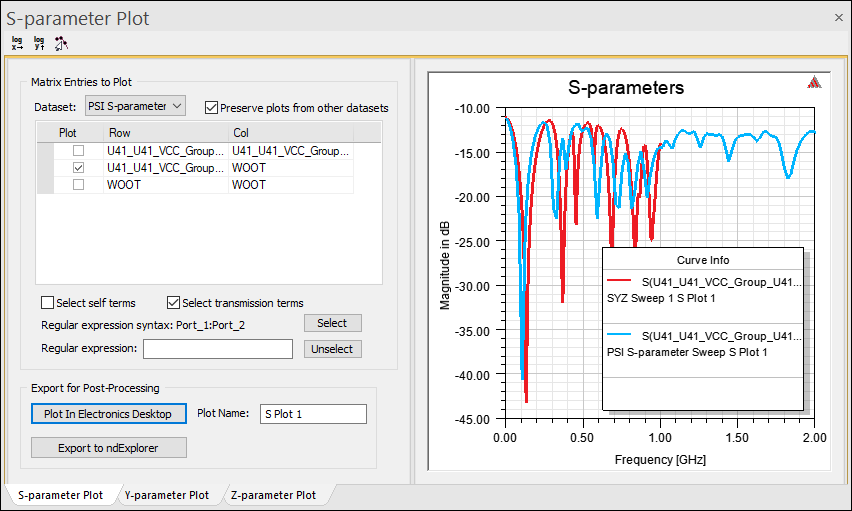
For certain SIwave plots, such as S-, Y-, and Z-parameter magnitude plots and IL/RL/NEXT/FEXT plots, you can change how the plot displays.
Double-clicking within the plot enables opens the Properties window on the relevant tab.

Tabs include:
- Cartesian
- General
- Grid
- Header
- Legend
- X Axis
- X Scaling
- Y Axis
- Y Scaling
Each tab allows you to specify display units, colors, fonts, and scaling for the relevant plot element. Select Show Hidden on any tab to view additional options.