
Using Families Tab for Reports
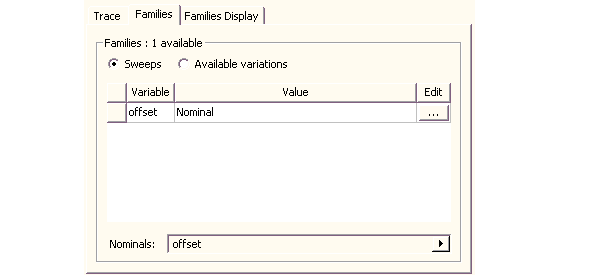
The Families tab of the Report dialog provides a way to select from valid solutions for sweeps where a simulation has multiple variables defined and solutions exist for multiple variable values (for example, for a parametric sweep). If no variables are defined, or none have solutions for different values, 0 families will be available. If so, the variables other than the one chosen as the X (Primary sweep), are listed under the Families tab with columns for the variable, the solution value (which may be All, Nominal, or a Specific value), and an Edit column with an ellipsis [...] button. Families gives the number available. If an existing variable is specified as Nominal, only that value is currently available. You can set any solved variables as Nominal, All, or select from values provided for Available solutions.
When you select a variable with multiple solved values, a trace for each solved value appears in the Report, with the variable value appended to the trace name in the Report legend.

You can make selections for the following:
- Select the Sweeps radio button (the default) to list the swept variables you can select.
- With the Sweeps radio button selected, click the ellipsis [...] button to display a list of variable values for a particular variable. You can use a scroll bar to navigate the list.
- To select all values, click the check box for Use all values. This writes “All” in the value field for that variable. You can also select individual values by clicking on them.
- To select a range of values, hold down the shift key, and click again.
- To select intermittent additional values, hold the Ctrl key and click additional. The values you select are highlighted in the list, and are also listed in the Values column for that variable.
- To select all, use the Select All button. This highlights the complete list, as well as listing all values for the variable in the Value field.
- To clear the selections, use the Clear All button.
- To edit the available list, click the ellipsis [...] button to display the Edit Sweep dialog. For the selected variable, this lets you specify:
- a single value as value and units
- a linear step with start value, stop value, and step value, and units for each.
- a linear count, with start value, stop value with units, and a count.
- a decade count
- an octave count
- an exponential count.
- Click OK to close the Edit Sweep dialog box. You must still select the Edited radio button to be able to select the from the edited list, rather than the Default selection. And you must make selections here to move the new values to the variable value list in the Families tab.
- To select individual variations, check the select box.
- Click the Select button at the top of the column to check or clear all variations at once.
- To invert the list order, click the triangle beside the variable name.
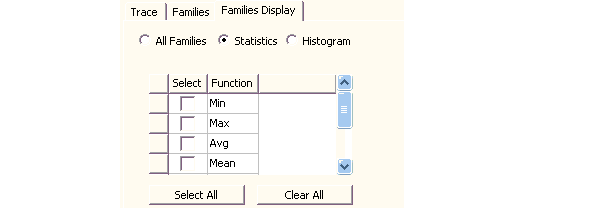
- All Families
- Statistics which lists a table statistical functions that you can select to apply to the plot. The functions include Min, Max, Avg, Mean, Variance, Std Dev, and Sum. You can use the Select check boxes or the Select All and Clear All button.
- Histogram which lets you select the number of bins to use for a histogram plot, and the sampling frequency to use.
Once you have specified the changes you want, you can add you change to the list by clicking Add>> or replace the current list by clicking Update>>.
Select the Available variations radio button to list the choices that derive from variable combination.
The Families Display tab has three radio button selections:

Related Topics
Modifying the Background Properties of a Report
Modifying the Legend in a Report
Creating Custom Report Templates
Editing the Display Properties of Traces