
Specifying Points to Create Limit Lines
- Click Report2D > Add
Limit Line > Specify Points or right-click on an XY plot
and select Add Limit Line > Specify Points
from the shortcut menu to open the Edit Dataset
window.
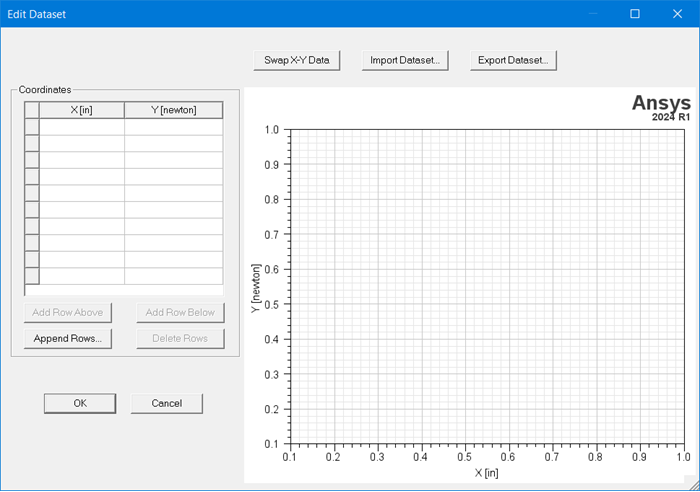
-
enter the XY coordinate values directly.
-
import XY values from a tab-delimited .tab file.
-
export Dataset to a file.
- When you click OK,
the limit line you defined is added to the plot. The line divides the
plot into regions within the context of its length. By default, the region
above the limit line is hatched.
You can use this window to
If you require additional data points, you can use the buttons to Append Rows to the Coordinates table. If you select a row in the Coordinates table, you can then use the buttons to add a row above or a row below the selected rows, or to delete rows.
You can use Shift + click to select multiple adjacent rows, or Ctrl + click to select any combination of rows for deletion.
Note: Each limit line
is associated with a particular Y axis (because it has to be scaled the
same way as all the curves associated with the axis, follow its log/linear
scale, etc.). This Y axis association defaults to the first available
Y axis when the limit line is created. However, if the plot contains
multiple Y axes, it can be associated with a different Y axis later via
its properties tab.