
Editing Limit Lines
You can select a limit line in a plot to edit the following properties on the Limit Line tab of the plot properties dialog.
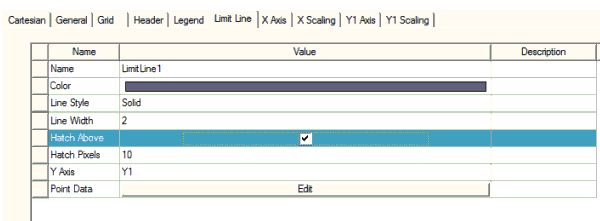
- Color – affects both line and hatching
- Style and Width – affects only the line, not the hatching
- Y Axis Y– axis associated with the limit line
- Hatch Pixels – sets the length of the hatch lines
- Point Data – edit the data that defines the limit line
- Hatch Above – sets the direction of the hatch lines (above or below) the limit line
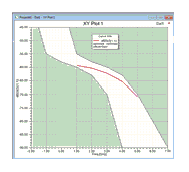
For example, if you add a second limit line, you could designate it as hatch below by unchecking Hatch Above to produce a “tunnel” marking the upper and lower constraints.
Related Topics
Specifying Points to Create Limit Lines
Creating Limit Lines From a Selected Curve
Modifying the Background Properties of a Report