Creating Limit Lines From a Selected Curve
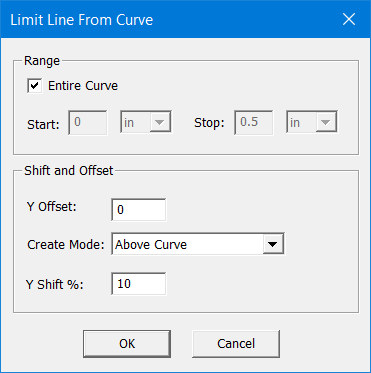
- To create limit lines from a selected curve you must first click on the desired plot curve and then select From Selected Curve to open the Limit Line From Curve dialog.
- The Limit
Line From Curve dialog allows you to create limit lines over
the Range of the Entire Curve, or between specified X-axis
Start and Stop
points. Create Mode controls whether
limit lines are Above Curve,
Below Curve, or Above and Below Curve. You can also specify
a Y Offset value, which sets a
constant distance between the curve and limit line(s); and a Y Shift %, which shifts the limit line(s)
by the specified percentage of the Y-axis values. In the following example
the upper limit line has a Y Offset value of 0.01 and no Y Shift %, while
the lower limit line has a Y Shift % of 30 and no Y Offset,
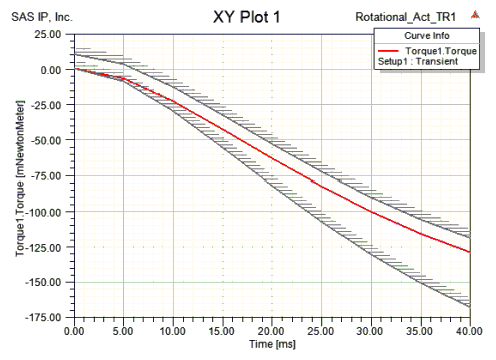
- When you click OK, the limit lines you defined are added to the plot. The lines divide the plot into regions within the context of its length. By default, the region above a limit line is hatched.