
Setting Mesh Plot Attributes
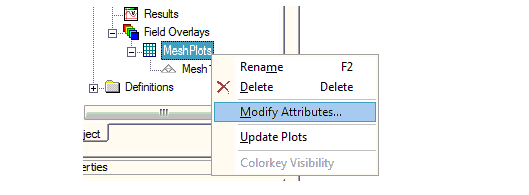
- Under Field Overlays in the Project Manager tree, right-click the MeshPlots icon and select Modify Attributes. The Mesh Plots dialog box opens.
- Click the Save as default button if you want the tab’s settings to apply to mesh plots created after this point.
- Select Real time mode if you want the changes to take effect immediately in the view window.
- Click Close to dismiss the dialog box.
You can also select Maxwell 2D or Maxwell
3D > Fields > Modify Plot Attributes ,
after which the Select Folder
dialog box appears. Select the folder containing the mesh plot you want to
modify, and then click OK to
display the Mesh Plots dialog box.
,
after which the Select Folder
dialog box appears. Select the folder containing the mesh plot you want to
modify, and then click OK to
display the Mesh Plots dialog box.
For mesh plots, the following attributes can be modified:
|
Plot |
A drop-down menu of available plots |
|
Scale Factor |
The size at which the tetrahedra are displayed. Scaling may let you better analyze particular situations. For example, a scale factor of 80% draws the tetrahedra at 80% of their original size. Use the Scale factor slider to increase (move to the right) or decrease (move to the left) the percentage of the tetrahedra size. |
|
The degree of transparency for the tetrahedra. This is useful for viewing objects or plots behind the current plot. Use the Transparency slider to increase (move to the right) or decrease (move to the left) the transparency of the plot. |
|
|
Mesh type |
Whether to display the tetrahedra as wire frame or shaded, and whether to add a grid |
|
Mesh Color for Line and Fill |
The color for the tetrahedra edge lines and fill. Clicking the button for each displays a color selection dialog box. |
|
Surface Only |
Whether to plot the surface only, or all tetrahedra inside selected objects |
|
Real Time |
Whether to show changes to a mesh in real time |
If this option is cleared, click Apply when you want to see the changes.