
Selecting the Display Type
The information in a report can be displayed in several formats. Select from the following Display Type formats in the Create Report dialog box:
|
A 2D rectangular (x-y) graph. |
|
|
A series of 2D rectangular (x-y) graphs stacked vertically, sharing a common x-axis scale, but with each trace having its own y-axis scale. |
|
|
A spreadsheet with rows and columns that displays, in numeric form, selected quantities against a swept variable or another quantity. |
|
|
A 3D rectangular (x-y-z) graph. |
|
| 3D Rectangular Bar Plot |
A 3D rectangular (x-y-z) bar graph. |
|
A rectangular (x-y-z) graph. Contour plots are useful to visualize surfaces (for e.g. Directivity as a function of phi/theta). |
You can also modify the display type of an existing plot from the Properties window for that plot. Select the Report icon in the Project tree to display the Properties window. Selecting the Display Type field displays a menu with selections available for that plot.
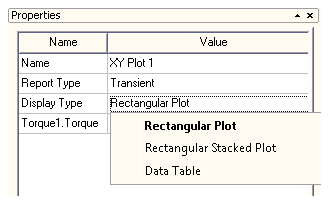
Once you make a selection, the plot display updates for the current selection.