
Plotting Field Line Trace Overlays
For Maxwell electrostatic solutions, Field Line Trace overlays allow you to plot E field lines in 3D space and on insulator surfaces. The E field lines allow users to calculate the inception voltages for breakdown analyses.
To plot a field line trace overlay:
- Select a surface from the geometry model or from a scalar surface plot.
-
Launch the Create Field Line Trace Plot dialog from the main Maxwell > Fields > Field > Field Line Trace menu, from the modeler context menu, or from the Fields Overlay context menu in the project tree.
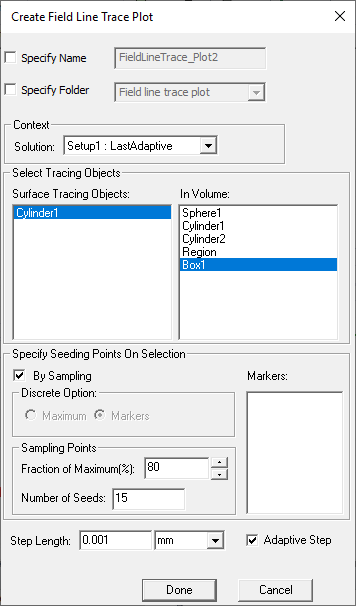
- To specify a name for the plot other than the default, select Specify Name, and then type a new name in the box. The Specify Name field shows a default name based on the field quantity you selected,
- To specify a folder other than the default in which to store the plot, select Specify Folder, and then click a folder in the drop-down menu. Plot folders are listed under Field Overlays in the project tree. Plot folders let you group plots with the same quantity together. All field plots under the same folder share the same color key.
- Select the desired Surface Tracing Objects and In Volume from the respective lists. You can use the Ctrl and Shift keys to select multiple items.
-
The Specify Seeding Points on Selection panel allows you to manage the seeding points that will be used when calculating the trace lines:
- If By Sampling is not selected, you can select either the Maximum, or Markers if markers for an E Field overlay plot have been set.
- If By Sampling is selected, Maximum and Markers choices are disabled, and you can set a Fraction of Maximum (%) percentage value and the Number of Seeds to be used when calculating trace lines.
- Enter the Step Length and unit. Step length controls the spacing between evaluation points along the E field direction. If Adaptive Step is checked, the step length will be inversely proportional to the E field strength.
- Click Done to close the dialog box.
You can now analyze the design to generate the field line trace plot. After the field line trace plot has been generated, you can invoke the Inception Voltage Evaluation dialog box, which allows you to calculate the breakdown voltage - the voltage at which corona discharge will occur for the selected seed position and gas type.
Related Topics
Plotting Noise Vibration Overlays