Inception Voltage Evaluation
For Maxwell electrostatic solutions, Field Line Trace overlays allow you to plot E field lines in 3D space and on insulator surfaces. After a field line trace plot has been generated, you can invoke the Inception Voltage Evaluation dialog box, which allows you to calculate the breakdown voltage – the voltage at which a corona discharge will occur for the selected seed positions and gas type.
To evaluate inception voltages:
-
For any solved field line trace plot, launch the Inception Voltage Evaluation Dialog from the Fields Overlay context menu in the Project Manager tree.
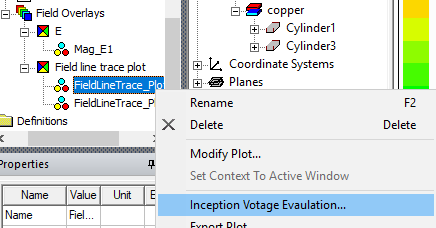
The Inception Voltage Evaluation Dialog window opens.
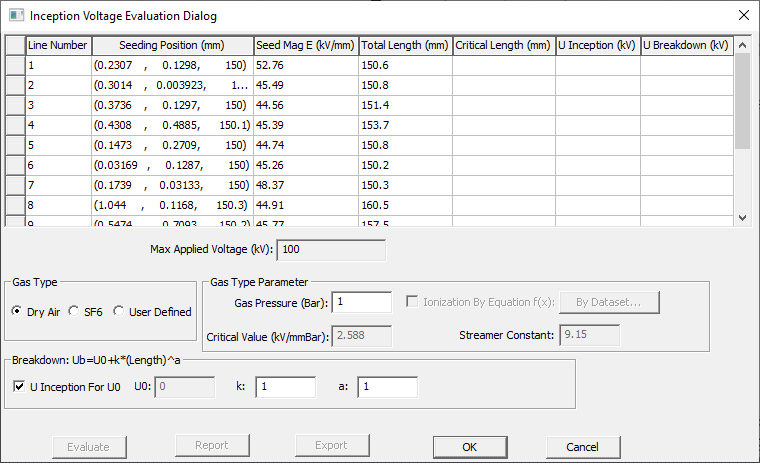
- The Gas Type panel allows you to choose either Dry Air, SF6 (sulfur hexaflouride), or a User Defined gas. The selection controls which gas type parameters can be entered.
-
In the Gas Type Parameter panel:
- For Dry Air and SF6, only the Gas Pressure value (in Bar units) can be adjusted. The Critical Value and Streamer Constant parameters are set to predetermined values.
- For User Defined gas types, in addition to Gas Pressure, you can also set values for the Critical Value and Streamer Constant parameters. Additionally, you can click the By Dataset button to open an Edit Dataset dialog in which you can enter data points that define the Ionization Coefficient Curve for the gas type you are using. If you check Ionization By Equation f(x), you can specify a function for Ionization (for example, 16.8*x –81.0). Typically, the User Defined values would come either from experimental test results or from a manufacturer.
-
In the Breakdown panel with U Inception for U0 unchecked, you can enter the U0, k, and a parameters for the breakdown equation where the Length is the total length of the concerned trace line. When U Inception for U0 is checked, U0 is the evaluated inception value.
- Select the row(s) for which you wish to evaluate Critical Length (mm) and U Inception (kV), and U Breakdown (kV) values. You can use the Ctrl and Shift keys to select multiple rows. You can select all rows by double-clicking any cell. You can sort by column by clicking the column header, click it again to reverse the order.
- Click Evaluate to have Maxwell generate the Critical Length (mm), U Inception (kV), and U Breakdown (kV) values for the selected rows. This data can be useful when choosing the insulation for a design.
-
You can select one or more rows from the Inception table to create a XY plot by clicking the “Report” button. A curve will be created for each selected trace line. It will be a curve of MagE of each point on the trace line vs the segment length of the point to the starting point of the trace line. For example,
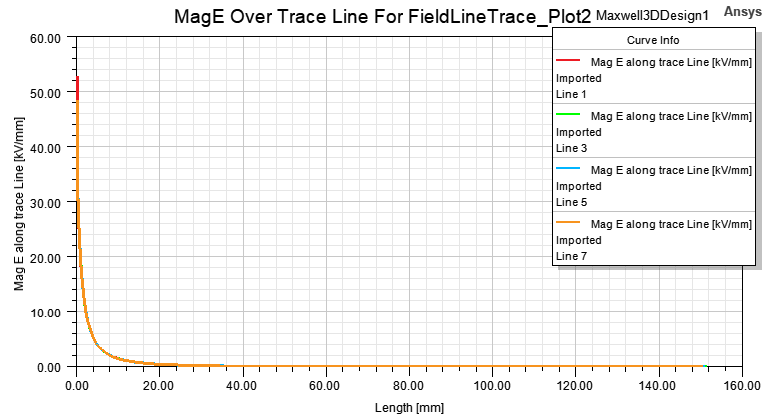
-
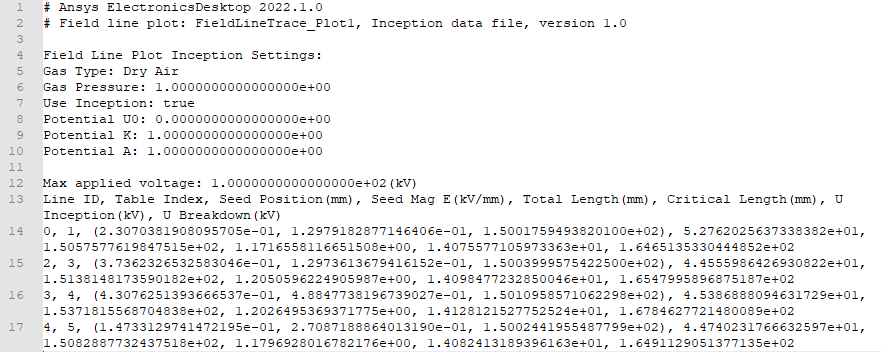
When U Inception (kV) and U Breakdown (kV) are computed for any trace lines, the Export button is enabled. You can select any rows to export or export all computed rows if there is no selection. (However, if any of the selected lines don’t have computed inception/breakdown data, the “Export” button will be disabled.) The data is exported as a text file.
A sample exported text file (*.txt) is shown below, which includes the Field Line Plot Inception Settings that are used to compute the inception and breakdown voltages. It also includes the maximum applied voltage for the design and the inception table for the exported lines.