Defining a Characteristic Curve in SheetScan
Once you have loaded a datasheet picture in the editor and have defined a coordinate system, you can define one or more characteristic curves as follows:
- Choose Curve > New.
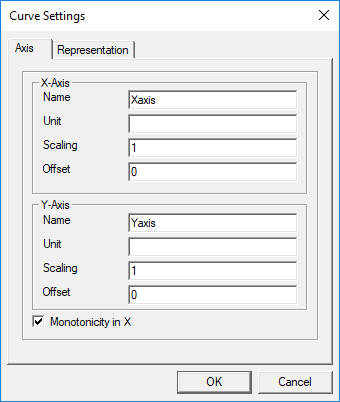
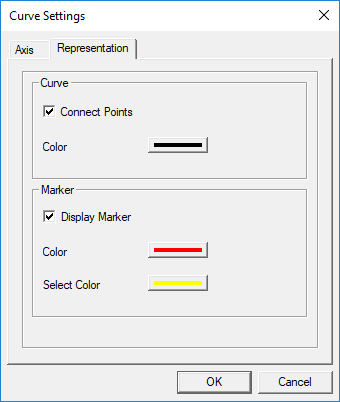
The Curve Settings dialog box opens, containing the Axis and Representation tabs.


- Use the fields on the Axis tab to define the curve's properties. Use the buttons on the Representation tab to change the curve's appearance.
- Click OK.
The cursor changes to a crosshair.
- Click the points of the characteristic which you want to capture for the dataset. The points are connected automatically.
- Repeat steps 1 through 4 for each additional characteristic curve you wish to define.
After characteristic curves have been defined, you can perform various operations on them. See: Performing Operations on SheetScan Curves.
