Defining a SheetScan Coordinate System
You can define a coordinate system for a graph on a datasheet picture that you have previously loaded into the SheetScan editor.
To define the coordinate system:
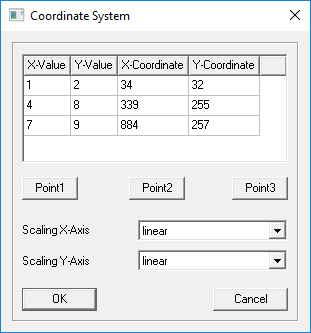
- Select Coordinate System > New to open the Coordinate System dialog box.

You can enter points manually or select them using a crosshair.
- To activate the crosshair cursor, click Point1.
The cursor transforms into a crosshair.
- Position the cursor over a corner of the datasheet graph and click the left mouse button.
The Coordinate System dialog box reappears, displaying the X- and Y-Coordinate values for the chosen point.
- Enter the X-Value and Y-Value for this point. Typically, these values will correspond to the values taken from the axis scale values on the datasheet.
- Select the desired scaling (linear, logarithmic, or decibel) for both the X and Y axes.
- Repeat the above steps for Point2 and Point3.
- Click OK.
The grid is placed over the graphic.
Note:- You can edit the grid after placement by selecting Coordinate System > Properties,
by clicking the coordinate system icon on the Curve toolbar (
 ), or by right-clicking in the
SheetScan editing window and selecting Coordinate System.
 - You can hide the grid by selecting View > Grid.
- You can edit the grid after placement by selecting Coordinate System > Properties,
by clicking the coordinate system icon on the Curve toolbar (
- You can now define a Characteristic Curve.
