
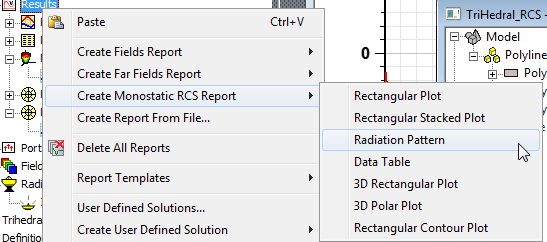
Overlaying Monostatic and Bistatic RCS 2D Plots
You can Monostatic and Bistatic 2D radiation pattern plots, in a similar way that you can overlay Monostatic RCS 2D Polar plots and Bistatic RCS 2D Polar plots, as well 3D Polar Plots and 2D Radiation patterns. As with regular radiation pattern plots, the eligibility depends on whether the RCS plot is defined on a single plane. The following is an example of a Monostatic RCSTotal Plot for a TriHedral SBR+ model:

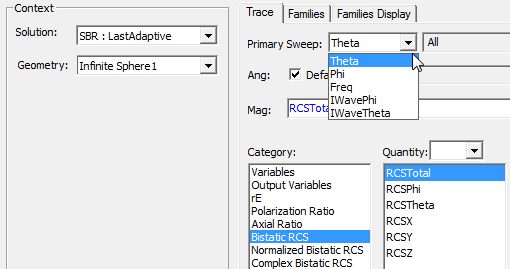
There are two cases of eligible Monostatic and Bistatic plots for overlay, defining a single plane in a 2D Polar Plot.
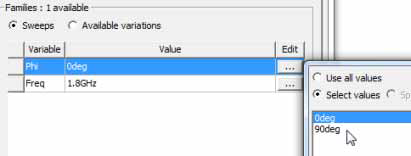
- For Primary sweep on Theta or IWave Theta, with the Phi or or IWavePhi to be any single value of the sweep, typically 0 or 90, but any single phi value is allowed.
- For Primary sweep on Phi or IWavePhi, Theta or IWaveTheta is either +/-90 deg.
Monostatic RCS Reports appear as options for models with SBR+ regions.
Bistatic RCS appears under Category for Far Field Reports in projects that contain SBR+ Regions.
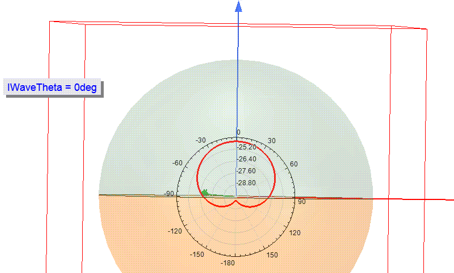
The following figure shows a Bistatic RCS Plot during animation with respect to Theta angle.
Radiation Pattern plots are added to the Overlay radiation field dialog that displays when you right-click Field Overlays in the Project Tree and select Plot Fields>Radiation Field... from the shortcut menu. The dialog lets you toggle visibility for the Model window and set plot parameters for Transparency, Scale, and Type (2D or 3D).
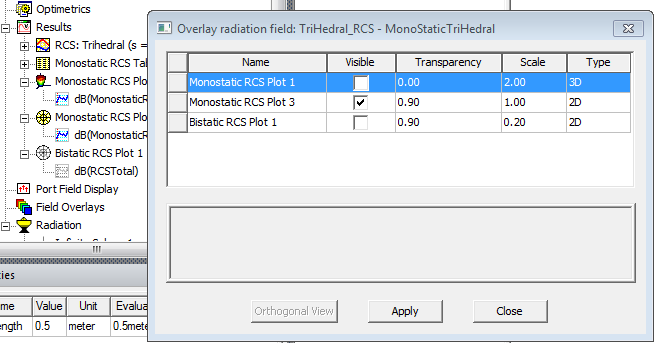
There are several cases mentioned above where an overlay will not be valid for display. This includes any radiation plot that has multiple planes. The Overlay radiation field dialog always lists all possibly overlays for selection, whether they are valid or not. However, if you check the Visibility column an overlay that is not valid, and then click Apply, the text field in the dialog gives a warning describing why the overlay is not valid, and then unchecks that overlay. Similarly, if a valid overlay is already being shown, and then you edit the plot settings or antenna parameters such that the overlay becomes invalid, the visibility column becomes unchecked and the overlay stops displaying.
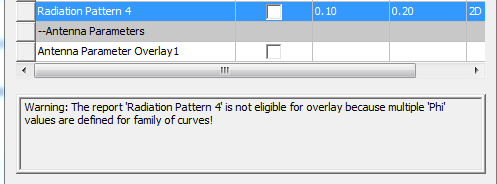
You can then use Modify Report to change the plot based on the warning to make it valid for display.
When the plot is valid, Apply then shows the plot in the modeler window..
If you have saved Antenna Parameters for Overlay, you also use this dialog to control whether to display a table of antenna parameters. See Antenna Parameter: Save for Overlay.