
Modifying Field Plots
- Click
 , or in the Project Manager, select the Field Overlays icon, right-click, and select Modify Plots, or press the M hotkey.
The Select Field Plot(s) dialog box appears.
Optionally, you can right-click an existing plot listed under the Field Overlays in the Project tree, bypass the Select Field Plot dialog box and go to step 3.
- Select the plot you want to modify in
the Select column, and then click OK.
The Modify Field Plot dialog box opens.
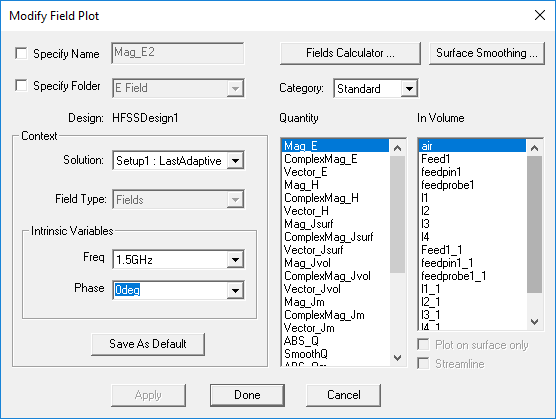
- Optionally, select the Specify Name check box to enable the name field.
- Optionally, select the Specify Folder check box to enable the drop-down menu.
- Optionally, select a different Solution from the drop-down menu.
- Optionally, select a different Field Type, if available.
- Under Intrinsic Variables, specify the frequency and phase at which the field quantity will be evaluated.
- Optionally, select a different field quantity
to plot from the Quantity list.
- To choose a calculated expression, select Calculator from the Category drop-down menu. If you choose Calculator, click the Fields Calculator button to display the calculator.
- To choose a predefined field quantity, select Standard from the Category drop-down menu. Select from the Quantity list.
- For scalar quantities plotted on the surface of a geometry, the Surface Smoothing button is enabled. For vector quantities, the Surface Smoothing button is disabled. Surface Smoothing applies a selected level of smoothing based on the Gaussian Blur algorithm. Clicking Surface Smoothing opens the Gaussian Smoothing dialog box.
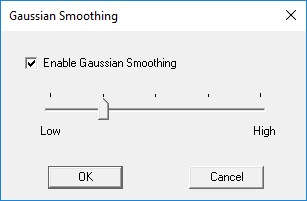
Select the check box to enable the feature and use the slider to set the degree of smoothing.
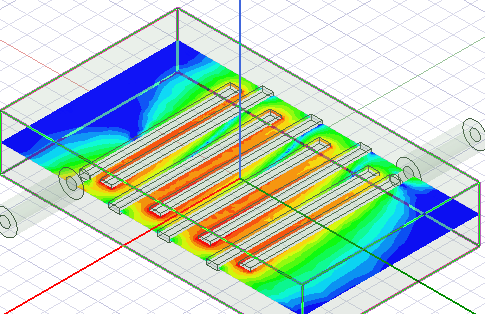
Important: You must click Apply in the Modify Field Plots dialog box to see the changes.
For example, this is a Mag_E fringe plot before applying the smoothing:
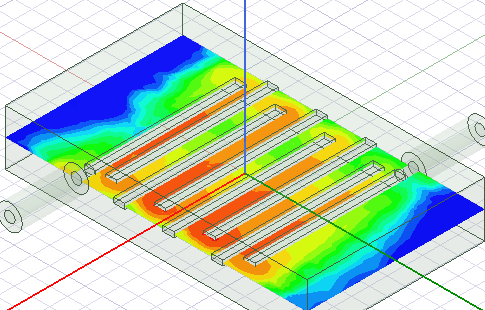
This is a Mag_E fringe plot after applying High smoothing:
- Select the volume, or region, in which
the field will be plotted from the In Volume list.
This selection enables you to limit plots to the intersection of a volume and the selected object.
- If you are modifying a plot on a sheet object, the Adjacent check box allows you to generate field overlays on a sheet object using data from either side of the sheet. An arrow indicates where the data is coming from.
While the data is usually the same on the two sides of a sheet object, in a situation where the sheet object is assigned to be a shell element, the field may be different on its two sides. (Shell elements are an option for Layered Impedance Boundaries and Finite Conductivity Boundaries with DC conductivity and two-sided selected.)
In such cases, you can visualize the field data on the side you want.
- Click Apply to make the changes and leave the dialog box open,
or click Done to apply the changes and close the dialog box.
The field quantity is plotted on the surfaces or within the objects you selected. The modified plot is listed in the specified plot folder in the project tree.
The plot uses the attributes specified in the Plot Attributes dialog box. For details see Setting Field Plot Attributes.