2D and Circuit PAM-4 Eye Plot
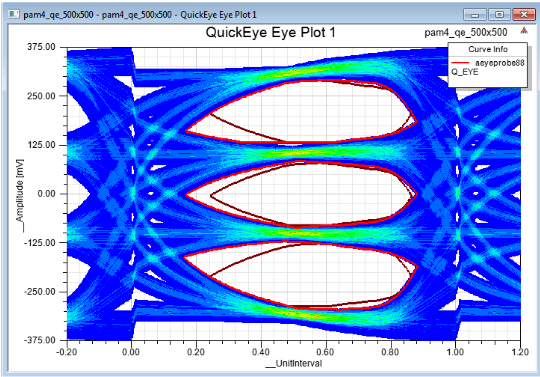
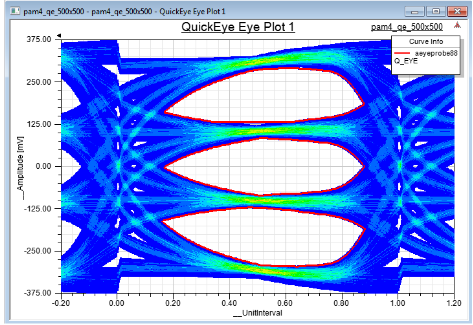
Eye diagrams created from PAM-4 voltage traces differ from regular (NRZ) eye diagrams because they have 4 symbol levels that create three distinct sub-eye openings between the three sequential pairs of symbol levels.
A PAM-4 modulation can be set up using any of the following:
- Transient Analyses
- Eye Source for QuickEye
- AMI Transmitter for AMI Analysis
For more information, see PAM-4 Transient Analysis.
After a successful analysis using PAM-4 modulation, to display an eye plot of the Transient, QuickEye, or AMI results:
- Click Product > Results or, on the Project Manager window, expand the Project Tree and [active design folder], then right-click Results. Navigate to the appropriate report type . Then select Statistical Eye Plot or Eye Diagram Plot to open the New Report window.
- Selections in the report window are context-sensitive. Whatever Eye Probe/Scope settings are chosen determine the relevant output quantities from which you may select. For example, setting the Eye Scope context to an existing Eye Probe result in the display of quantities that are relevant to the Eye Probe. Whereas choosing Others in the Eye Scope list box displays all other voltage, current and power quantities.
Select the output quantities of interest and click Add Trace. - Click Done. A Report window opens to display a graph of the analysis results.
Statistical Eye Plots of PAM-4 Results
A Statistical Eye Plot of a PAM-4 transmission resembles the following:
An additional “Consolidated” eye, is also displayed. The consolidated eye is created by superimposition of the three sub-eyes aligned along their voltage reference levels. The consolidated eye shows the worst-case eye opening and serves as a simplified measure of the goodness of the eye. The user chooses to use the visual and measurements on the consolidated or individual sub-eyes.
The consolidated eye display is controlled by a trace property: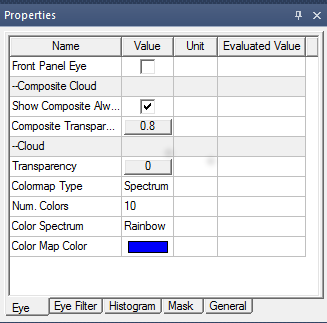
Voltage Plots of PAM-4 Results
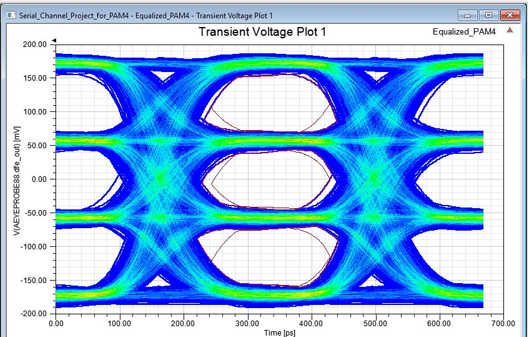
When you generate a Rectangular Eye Diagram from PAM-4 data, the waveform sub-view can be zoomed in to show the boundaries of the unit intervals (black lines) and the inner-eye contour overlay: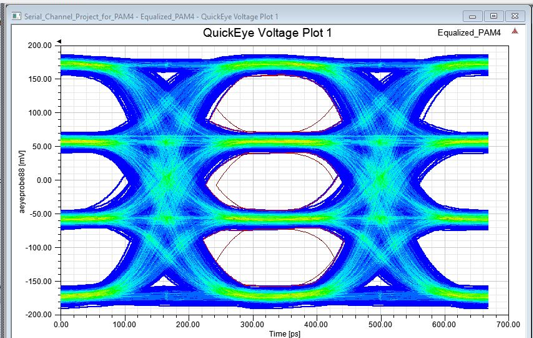
Eye Measurements for PAM-4 Plots
PAM-4 eye diagrams support only the MinEyeWidth and MinEyeHeight measurements. To add trace characteristics, right-click the plot and select on the following options:
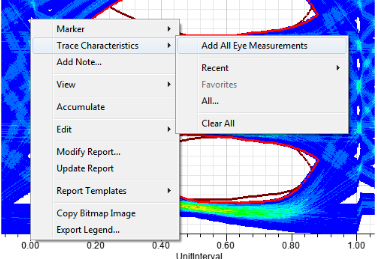
When Add All Eye Measurements is clicked, only the supported MinEyeHeight and MinEyeWidth are added to the plot. Any other measurements display NaN if added.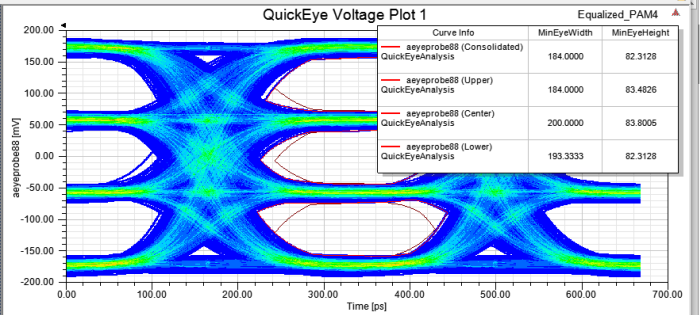
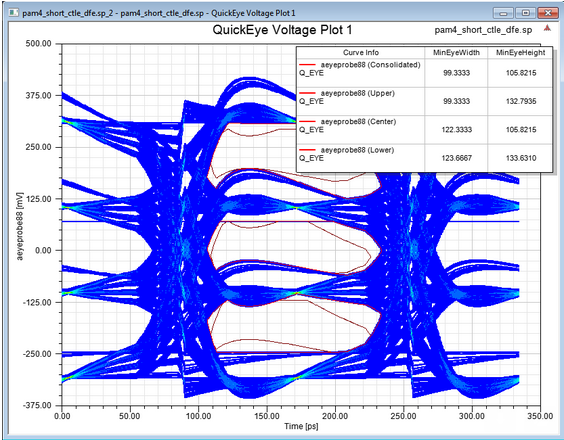
PAM-4 trace characteristics are displayed for each sub-eye and include the consolidated measurement. The sub-eye names and top-to-bottom sorting allow easy mapping of the numbers to the visual. When the Legend is exported (via the shortcut menu), the entire table along with the sub-eye name annotations is also exported.
Related Topics
2D and Circuit New Report Window
2D and Circuit Report Display Types

