


Functional data
Some material properties vary with respect to other properties. This type of data is represented as functional data and can be viewed from suitable material record datasheets.
Data often does not have a fixed value, but varies with some parameter. For example, many material properties vary with temperature, and the cost of a manufacturing process per unit can vary with the total number of units that are made.
To represent this type of data, Granta Selector uses Functional Range and the Functional Point data types. The functional data is stored in the database either as a set of discrete points, or as a mathematical expression. The two functional data types behave exactly like the Range and Point data types, except that their value depends on the value of their associated parameters.
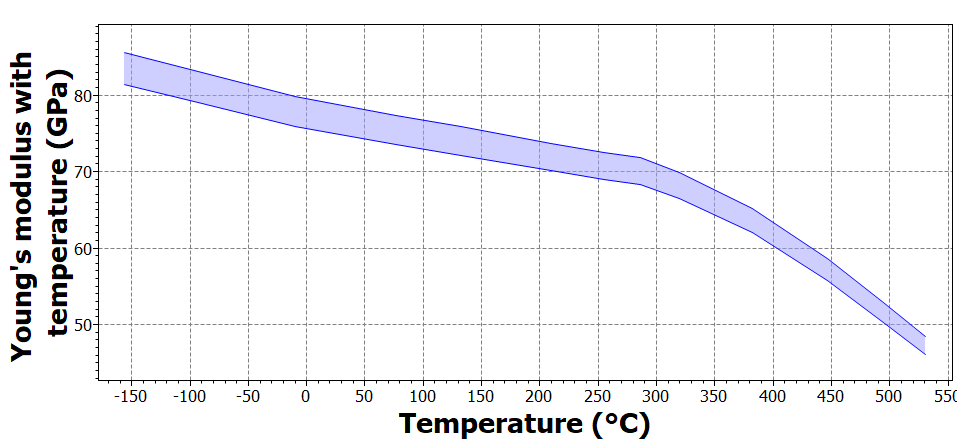
Young's modulus, for example, varies with temperature, and certain material datasheets contain the functional attribute "Young's modulus with temperature". The data value is evaluated at the default project parameter values, although this can be changed by clicking Parameters underneath the attribute and editing the parameter value.

The variation of the functional attribute with its associated parameters can also be viewed as a graph. One parameter is plotted on the x-axis, and the value of the attribute is plotted on the y-axis.
If a functional attribute is dependent on more than one parameter, the values of the other parameter are fixed. You can edit the values for the fixed parameters, or you can use the project defaults. These values apply only to the displayed graph. It is possible to view but not edit the raw data points for the graph.
-
Click
 Functional Chart by the functional data property.
Tip: You can expand or collapse all functional data displayed on the current datasheet by clicking
Functional Chart by the functional data property.
Tip: You can expand or collapse all functional data displayed on the current datasheet by clicking Show/Hide.
 - Optional:
While viewing a functional chart, use the following options to interact with
the data:
Option Description Edit the chart axis Click  Settings and choose between
Logarithmic and
Linear axis scale.
Settings and choose between
Logarithmic and
Linear axis scale.View the data point values for Grid and Series data Click . Change the x-axis parameter for Maths or Grid data Select the X-Axis Parameter from the list to plot the attribute value on the x-axis. Edit fixed parameter values for Maths or Grid data Click the Value field in the Fixed Parameters section, and enter a new value or select a named value from the list. Note: The edited parameter value applies to this graph only.If the attribute is a function of only one parameter (set as the x-axis parameter), there are no fixed parameters.
Change between fixed and free parameters for Grid data Click Name to show the Grid data series corresponding to a single fixed parameter. Click again to clear the check box and display all the Grid data for the attribute (free parameters).