


The table editor can be opened from the context menu "Open With -> Reliability Table Editor" in the Model Browser. Currently, it supports one page that shows all structural elements of the model and their reliability related data as seen in the screenshot below.
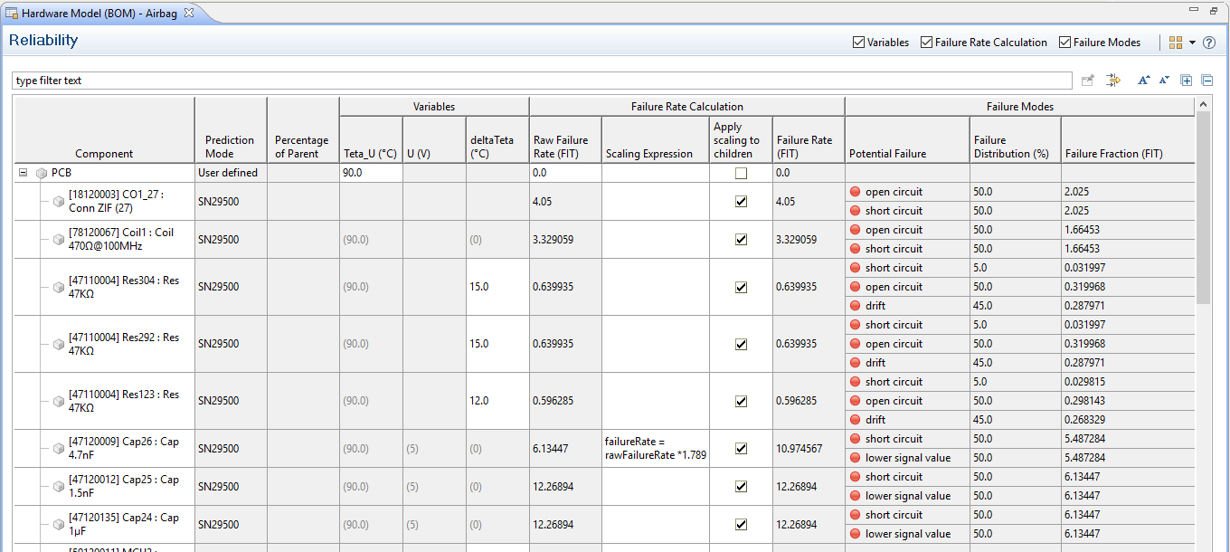
The table shows the whole containment hierarchy of elements and details about the failure rates and failure modes. In principle, the columns show the same information as the "Prediction" tab of the property view, but for multiple elements:
Component shows the element name and type label.
Prediction Mode corresponds to the mode how the failure rate is determined, i.e. user defined, from a catalog (SN29500, IEC62380, FIDES, MIL-HDBK), as sum of failure modes, or as percentage of parent.
Percentage of Parent shows the percentage of FIT that this part receives from its parent in case the corresponding prediction mode has been activated.
Mission Profile shows the used mission profile for the element. This is either an inherited profile from the container (e.g. package or model) or the mission profile directly assigned to the element. Note that inherited mission profiles are shown in parentheses.
Variables (group). This group shows the superset of all variables of all elements of the model. This gives a total view on all relevant parameters used during failure rate calculation. The columns are determined by the variables that exist in the model, so their number is dynamically determined based on all prediction information.
Note that this section can be toggled on/off via the corresponding option in the editors button bar (top right).
Failure Rate Calculation (group). The columns in this group show the "Raw Failure rate (FIT)", the "Scaling Expression" with its option to "Apply scaling to children", and the final "Failure Rate (FIT)" of an element.
Note that this section can be toggled on/off via the corresponding option in the editors button bar (top right).
Failure Modes (group). This group features the columns "Potential Failure", "Failure Distribution (%)", and "Failure Fraction (FIT)" showing the corresponding information.
Note that this section can be toggled on/off via the corresponding option in the editors button bar (top right).