


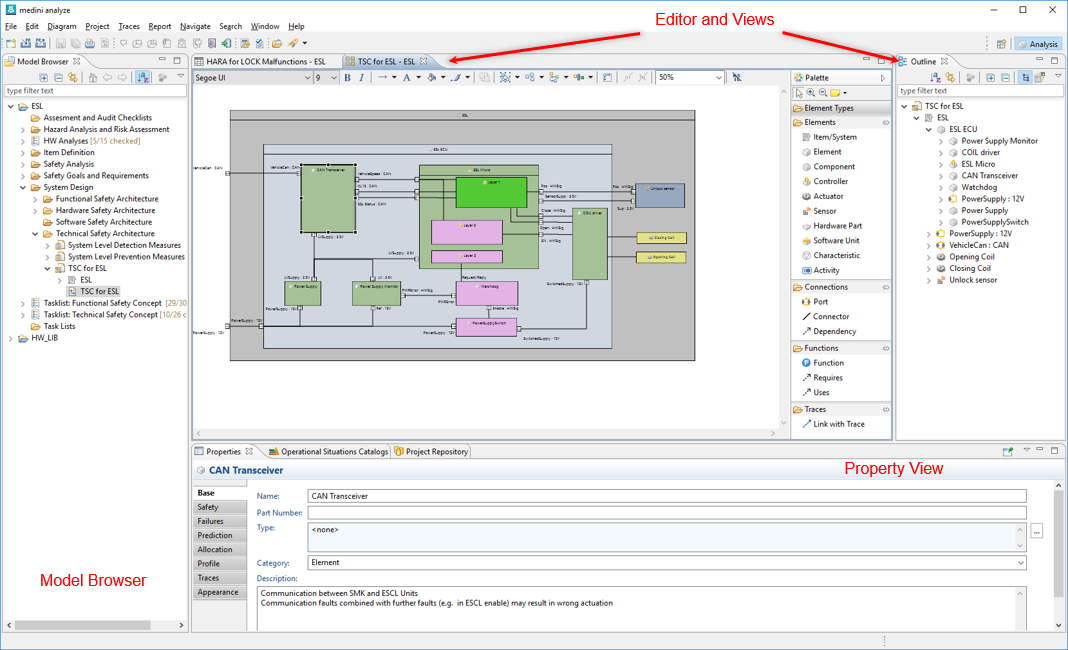
The main window of medini analyze allows you to manage your projects and its content. In this window you may create new projects, add new elements, and manage application options as well as project settings.
The tool features different views and editors that can be resized and positioned freely to your own convenience. Just click on the title area of a view, hold the mouse button down and move the view to your preferred placement and dock it there by releasing the mouse key. Views can also be detached from the main application by dragging them out of the window and re-attached at a later stage.
The main application provides by default two main views:
Model Browser: the central entry point to create or access projects and their content. From the Model Browser all editors of project content can be accessed, either by the context menu or the top button bar.
Property View: this view provides you context sensitive information about selected elements. Just select any object in the Model Browser or editors and the property view will show the detailed information about the object.
Further views can be opened from "Window | Show View..." top level menu of the application, see Enabling the other views.
Main Toolbar
medini analyze's main toolbar provides quick links to the key functions of medini analyze:
 Click this button to create a new
project.
Click this button to create a new
project. Click this button to import an existing
project into the workspace.
Click this button to import an existing
project into the workspace. Click this button to export a selected
project from the workspace.
Click this button to export a selected
project from the workspace. Click this button to save the current project.
 Click this button to print the current page in preview
mode.
Click this button to print the current page in preview
mode. Click this button to generate a report
from the table.
Click this button to generate a report
from the table. Click this button to open the task list
view, where you can track your running tasks.
Click this button to open the task list
view, where you can track your running tasks. Click this button to open the Open Task window, where you can
open old tasks or you can create a new task
Click this button to open the Open Task window, where you can
open old tasks or you can create a new task Click this button to search for a Model
Element or a Task with respect to their buttons exist from the drop down.
Click this button to search for a Model
Element or a Task with respect to their buttons exist from the drop down.
Depending on the currently active editor, the tool bar will adapt or certain actions are enabled or disabled.
Model Browser, Property View, and Editors
The Model Browser is the central view from where you can access and manage your projects. Each project is structured into a number of predefined folders - each folder serving a special task or group of tasks during the functional safety analysis and design. In addition you may create additional sub-folders for each predefined folder (and for user created folders). The initial folder structure depends on the safety domain profile and whether a project template has been used. See Project structure and Safety Domain Profiles for more details.
When selecting a model or object inside a project, the property view provides details on the selected object. It is a context sensitive view that change depending on the object type that is selected.
From the Model Browser, all editors for model elements can be opened by double clicking or via the context menu. Editors will show up in the "Editor and View Area" (gray area after startup), but they can be freely arranged. Different editors exist for the various types of models and elements such as form editors, table/worksheet editors, and graphical editors.
The "Save" button will be enabled after editing in an editor. Click the "Save" button to save your edited data. Note that you can do undo and redo even after saving the data. Each project provides a linear history of modifications that is kept until a project is closed or the tool is restarted.
Note: Saving projects will always save it locally in the workspace. To export the project you can use the "Export Project" function e.g. to create an MPRX file or the teamwork integration.
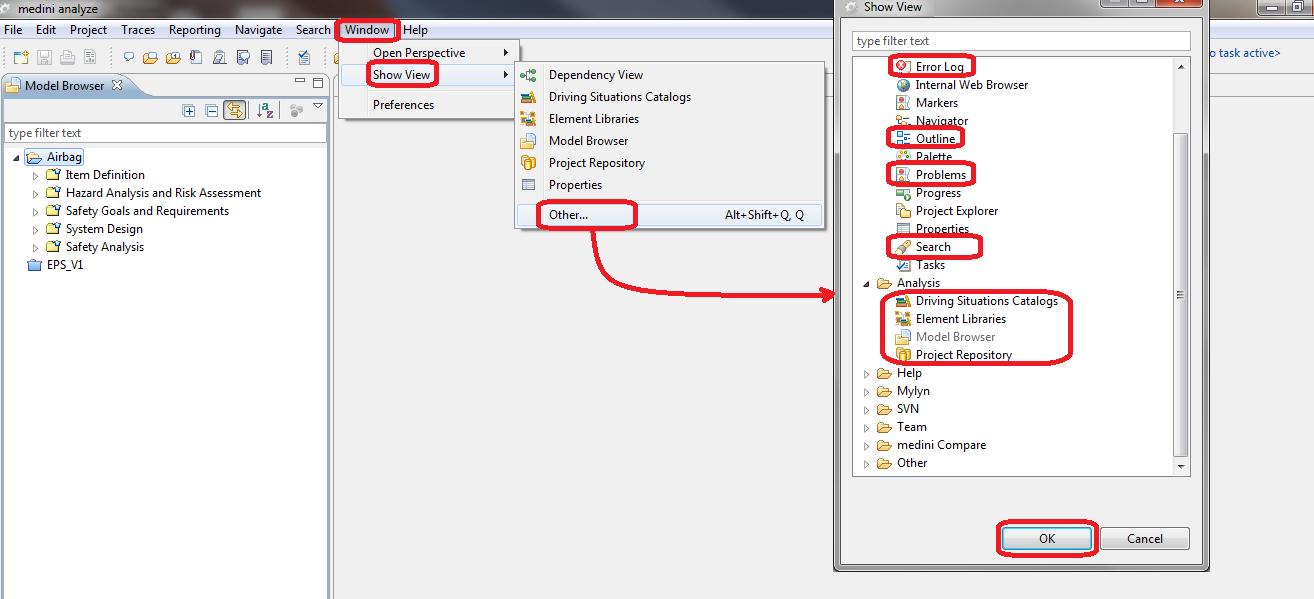
Besides the default views there are more views such as an Error Log View, the Problems View, or the Operational Situations Catalog View. Some of these views may not be important for your current task and are therefore they can be either closed or not shown by default. To open such a view, perform the following steps:
Select "Window -> Show View -> Other" from the main menu.
In the upcoming dialog select the required view and press "OK".
The views are organized in a number of folders - just open a folder to choose the view. The selected view will now be displayed in the tool. You can of course freely position and resize it to your convenience. Moreover, you can always close any of the views in medini analyze and reopen it later again as described above.
The following views may be supporting your work:
Outline (in General folder): to show a miniaturized outline of a full diagram or model contents. This helps to navigate in large diagrams and quickly access objects in a model.
Problems (in General folder): this view contains all error messages or warnings concerning medini analyze projects. The result of a validation are shown here (see Project Validation) as well as issues reported during migration (see Project migration after updating medini analyze).
Properties (in General folder): This view can be used to modify or show the properties of any selected element - e.g. graphical properties like color or line style but also the information carrying properties and their values.
Search (in General folder): This view is used to show the results of a search operation (see Searching)
Operational Situations Catalog (in Analysis folder): This view is used to display all operational situations catalogs of a project and the content of these catalogs. See Analysis based on Operational Situation Catalogsfor more details.
Model Browser (in Analysis folder): This is the standard Model Browser view of medini analyze. Choose this entry if you have closed the Model Browser unintentionally.
Dependency (in Other folder): This is the dependency view used to visualize relations between elements.
Error Log (in General folder): to show error messages, warnings or information concerning the medini analyze tool itself. Open this view when you encounter any problem caused by medini analyze or requested by the support team.
Note: Closing a view will not delete the data shown in that view - if you reopen it, it will show exactly the information it did show before closing.
The main views are also present in the menu "Window-> Show View" by a single click.

The sub-menu under "Show View" provides a quick access to the most frequently used views. You can activate e.g. the Dependency View, the Operational Situations Catalog View, the Model Browser View, or the Properties View directly.
Ansys medini analyze uses the Eclipse concept of perspectives. According to
http://www.eclipse.org/articles/using-perspectives/PerspectiveArticle.html
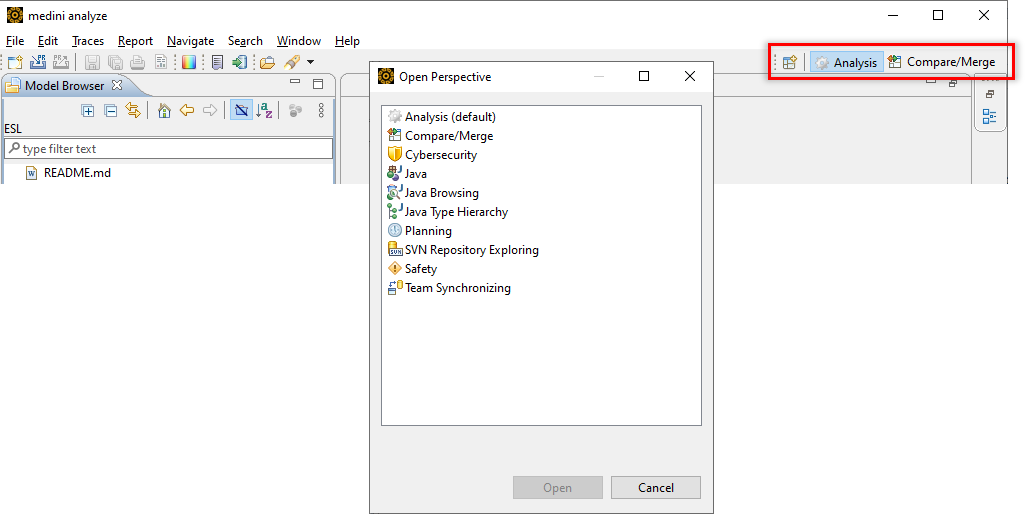
A perspective "determines the visible actions and views within a window. A perspective is also like a page within a book. It exists within a window along with any number of other perspectives and, like a page within a book, only one perspective is visible at any time." medini analyze defines an own perspective (the "analyze" perspective). The tool uses a set of perspectives that can be selected via the perspective action bar on top (see below):
Compare/Merge perspective for the difference analysis and model merge
Planning perspective for task management,
Cybersecurity perspective for cybersecurity focused analysis,
Safety perspective (filters out cybersecurity related UI)
The perspectives can be activated via the perspective buttons in the tool bar. The first button is used for the "Open Perspective" functionality and brings an dialog up to select perspectives for which the button is not available.
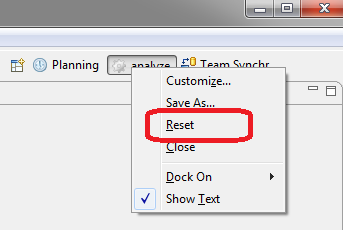
With a right click on a perspective, a menu is opened which allows to reset to the default settings of a perspective.
Ansys medini analyze allows you to set a number of tool-specific preferences. These preferences are valid for the local instance of the tool and for all projects which are opened in this tool. It means that when the same project is opened with another instance of the tool (for example, by another user), other preferences are applied. In addition to these tool-specific preferences, there are also project settings which are stored and shared together with a project and are only valid in the context of this project. For more information, see Project Settings.
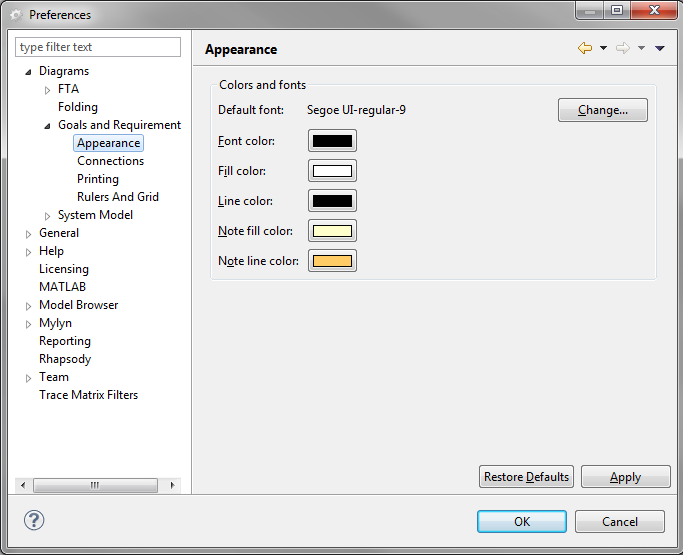
To modify the tool-specific preferences, select > . The window shown in the screenshot below appears. After selecting a category at the left side of the window you can adjust various settings of medini analyze. Most of the preferences influence the behavior and the look & feel of the different editors in medini analyze.
Note: Some categories have subcategories. This is indicated by a small white triangle (or a plus sign) in front of the category name. Click the triangle to expand the subcategories.
Some of the available settings are for color schemes, appearance of elements, or specific behavior of editors.
In addition, the following categories have a special meaning:
Licensing - here you can select the license file or set the parameters for accessing a floating license on a license server. For more information, see License Configuration.
Mylyn - here you specify settings for the task management (see Task Management & Commenting).
Rhapsody - here you specify settings for the integration with IBM Rational Rhapsody (see Import from IBM Rational Rhapsody).
Team - here you specify all the settings related to the usage of a versioning system