PSD Load
- Load Data
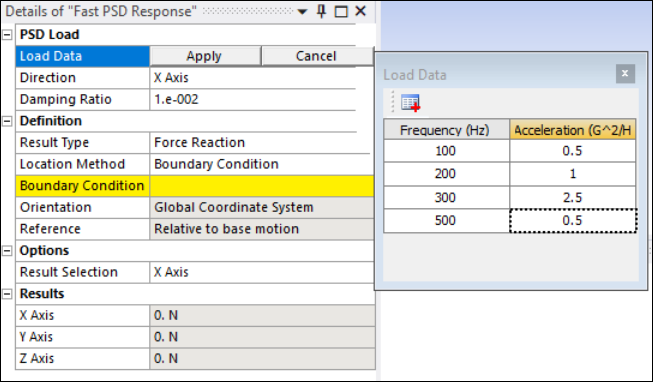
Specifies the input method for the PSD Load. You have the option to input Frequency vs. G Acceleration data in the tabular view.
- Direction
Indicates the direction of applied PSD excitation.
- Damping Ratio
Specifies the structural damping used in the analysis. Default setting is
0.01.
Definition
- Result Type
Specifies the type of result to be computed. Options are , , , and .
- Location Method
Determines where the result is computed. For the and result types, valid input are , , , and , meaning that results will be extracted from predefined boundary conditions or connection locations. See Reactions: Forces and Moments in the Mechanical User's Guide for more information.
For and , is the only supported option.
- Choose the specific boundary condition applied for result extraction from those available in the drop-down list. Valid boundary conditions are , and .
Note: Since the application uses participation factors from modal analysis to compute PSD response, you must use if is applied as contraint, otherwise results may be inaccurate.
- Choose the contact region for result extraction from those available in the drop-down list. Supports contact reactions using the underlying element option ().
- Choose the beam connection object for result extraction from those available in the drop-down list. You must also set the On Demand Expansion Option property to in the Analysis Settings.
- Choose the spring object for result extraction from those available in the drop-down list. Only grounded springs (springs with scoping) are valid.
- Since Fast PSD Response (Stress/Strain) is a point-based result, you can select a vertex or a node for this option.
- Orientation
Defines the coordinate system used for interpreting direction-specific results. Only supports for and . For and results, both and are supported.
- Summation
This is available for most Location Method property selections for the result type and enables you to select or for your scoped entity. If your selected Location Method does not display this property, the application automatically uses the centroid of the scoped entity for the moment calculation.
- Reference
Supports . This means the response of any location in a structural component is calculated in terms of the relative motion between the base and the structural component, and vice versa.
Options
- Result Selection
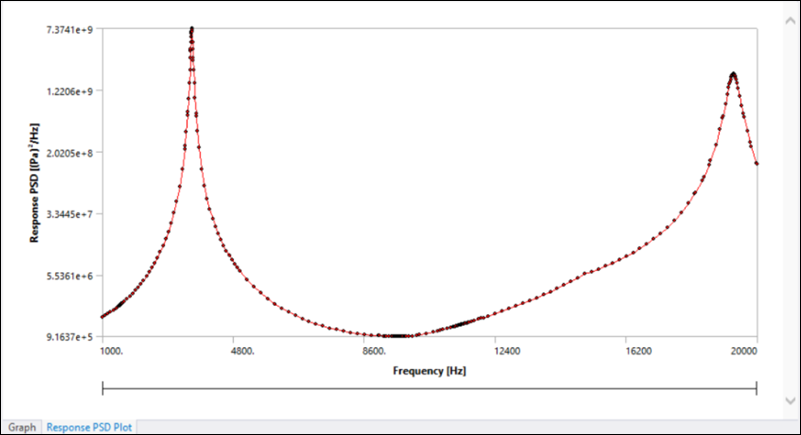
Defines the direction/component for PSD plot display, as shown in the figure below. For and result types, options are , and . For and results, equivalent (von-Mises) Normal and Shear components are computed.
Note: and PSD results are not supported for beam element nodes or for mid-side nodes of any element type.
Results
For the and result types, this displays the computed force/moment reaction values due to the PSD load in each direction (X, Y and Z Axes).
For the and result types, this displays Node ID, RMS Value, RMS Percentage and Expected Frequency.
- Displays the mesh Node ID used for the Fast PSD Response result. The application selects the node nearest to the specified scoping of the probe.
- Displays the value calculated during solution (square root of the area under the PSD response).
- Displays the percentage of the root-mean-square of the selected frequency range over the entire available frequency range.
- Displays the value calculated during solution (the centroid of the area under the PSD response with respect to frequency).