


Plated Through Holes (PTHs), also known as plated through vias (PTVs), are holes drilled through multilayer printed circuit boards (PCBs) that are electrochemically plated with a conductive metal (typically copper). These plated holes provide electrical connections between layers. Because these plated holes are metallurgically bonded to annular rings on the top and bottom of the printed circuit board, they act like rivets and constrain the PCB. This constraint subjects the PTH to stresses when the PCB experiences changes in temperature. Over time the PTH will experience fatigue and eventually fail due to crack propagation. PTH Fatigue is influenced by number of drivers, including temperature range, PTH diameter, PTH copper plating thickness, copper plating material properties, printed board thickness, printed board out-of-plane material properties, and quality of the copper plating. Ansys Sherlock calculates a time to failure using the industry-accepted model published in IPC-TR-579, Round Robin Reliability Evaluation of Small Diameter Plated-Through Holes in Printed Wiring Boards. Life calculation for PTHs subjected to thermal cycling is a three step process, involving a stress calculation, strain range calculation, and an iterative lifetime determination.
In this section, the following topics are covered:
The PTH Fatigue Analysis Module makes use of the following input data for the analysis calculations:
Life Cycle Reliability Goals
Size and location of all plated through-holes and vias
Circuit Card mechanical properties (stackup data)
Thermal Events and associated Thermal Maps
If any of the input data listed above is changed, Sherlock will automatically clear the analysis results for this analysis module.
The PTH Fatigue Analysis Module allows the user to set the properties shown here:
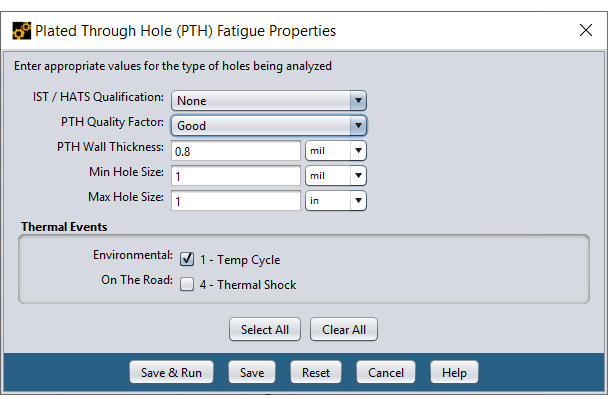
The IST / HATS Qualification property indicates the type of qualification process performed for the circuit card during production.
The PTH Quality Factor property indicates the overall quality of the plated through hole.
The PTH Wall Thickness property specifies the average thickness of the conductive material used to coat the PTH.
The Min Hole Size and Max Hole Size specify the range of hole sizes to be analyzed.
The Thermal Events panel allows the specific thermal Events to be selected for the analysis.
The PTH Fatigue Analysis Module generates the following results:
Summary Panel showing overall scores, reliability goals, board properties, hole properties, and analysis statistics
Life Prediction Curve for the circuit card based on the Cycles to Failure predicted for all holes analyzed
Score Distribution Chart showing a histogram of scores for all holes analyzed
Result Table showing key properties, Cycles to Failure and score for each hole analyzed
Graphical Layers showing the score for each hole analyzed
To see how the various input data and properties affect the PTH Fatigue Results, let's run a couple of tests with various inputs. We'll start by examining the results provided by the Tutorial Project. If you haven't already done so, import that project now.
Note: If you've modified data during the tutorials, it's likely that the PTH Fatigue Results have been cleared in your project or are different from those shown in this document. If so, the easiest way to clean things up is to delete the existing Tutorial Project and import it again from the ZIP file provided.
We’ll start by setting the PTH Fatigue properties as shown below. Afterwards, select Save & Run to commit the changes and run the analysis.
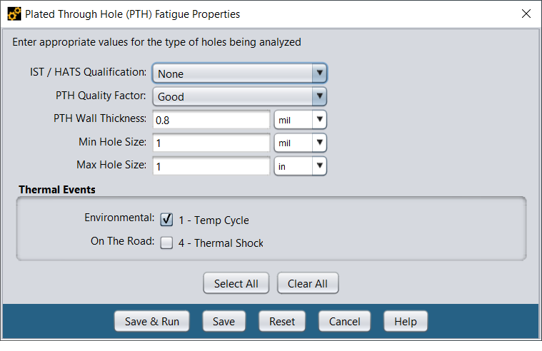
Afterwards, select Save & Run to commit the changes and run the analysis. Double-click the PTH Fatigue entry of the Analysis folder in the Project Tree to display the PTH Fatigue Results. Select the Table sub-tab to show the analysis results for all plated through holes analyzed.
Now, double-click the PTH Fatigue entry of the Analysis folder in the Project Tree to display the PTH Fatigue Results. Select the Table sub-tab to show the analysis results for all plated through holes analyzed.
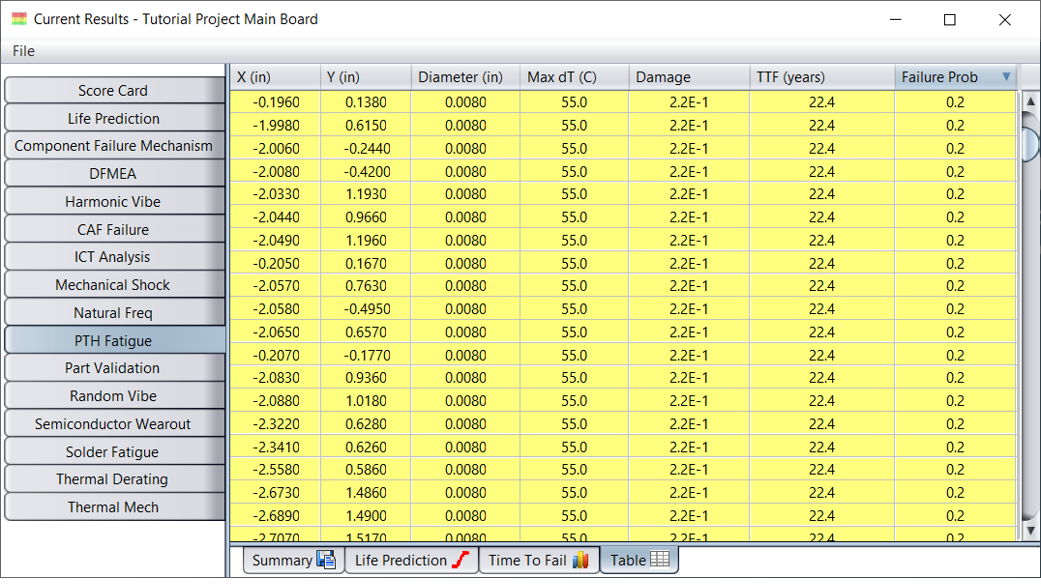
As is clear by the color-coding and data columns, all holes are predicted to fail within 22.4 to 47 years, which represents a safety factor between 3 or 5 more times the desired service life.
To see how the calculations are affected by the input properties, right-click the PTH Fatigue entry in the Project Tree and select the Edit Properties menu option to edit the input properties.
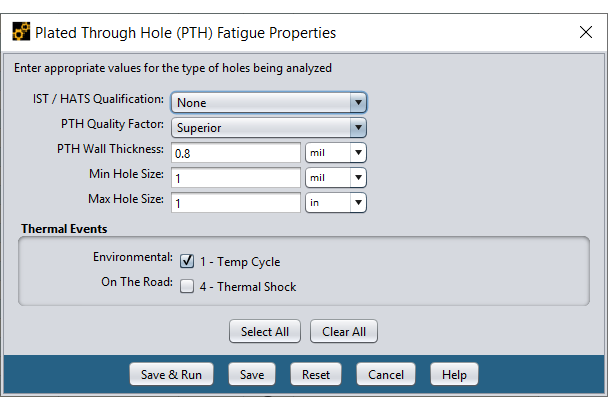
Let's change the PTH Quality Factor to Superior. After changing the property, press the Save & Run button to commit the changes and re-run the analysis.
While the analysis is being performed, the icon next to the PTH Fatigue entry will be changed to a clock indicating that a background process is being performed. When the analysis process is complete, the icon will change back to a GREEN check mark, at which point the PTH Fatigue Results panel will be refreshed.
Instead of looking at the tabular results, let's look at the Failure Distribution chart to see how the changes affected the predicted results.
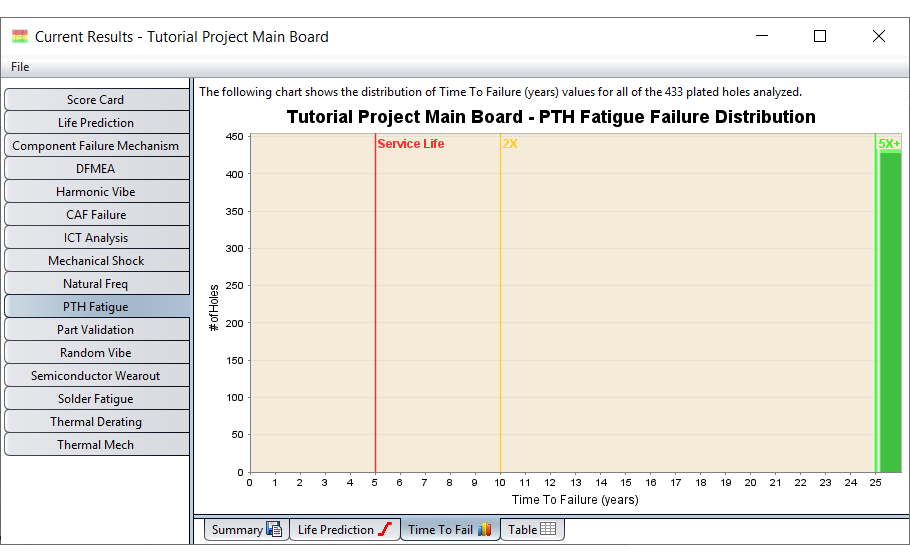
The Failure Distribution Chart is a histogram showing the various Time to Failure values predicted for all the holes analyzed. The X-axis shows the Time to Failure values, while the Y-axis shows the number of holes that are predicted to have a given TTF value. The chart allows you to easily see that our input property change has significantly changed the predicted results. Previously, the minimum TTF was 22.4 years, now the TTF is >50 years.
Now, let's see how the Thermal Events defined in the Life Cycle affect the PTH Fatigue Results. You may recall from our previous lesson that two Thermal Events are defined in the Life Cycle used by the Tutorial Project. The Temp Cycle Event models the daily ambient temperate cycle, oscillating between 10C and 32C over a 24 hour period, every day of the year. On the other hand, the Thermal Shock Event models a drastic temperature change from -40C to 105C over a short period of time, occurring 3 times per day. Essentially, the Temp Cycle Event is a relatively mild event that occurs over a long period of time, while the Thermal Shock Event is a relatively severe event that occurs over a short period of time.
In both cases, the Thermal Events themselves define uniform temperate changes across the entire circuit card. Furthermore, each of the input properties is also applied to each hole in the same way (for example, they all have the same PTH Wall Thickness). This uniformity of thermal and input properties means that that the only differentiation in the analysis results comes from the hole sizes.
We can change the thermal properties seen by each hole by assigning one or more Thermal Maps to the Thermal Events defined in the Life Cycle. Thermal Maps assign location-specific thermal values to the circuit card, causing variations in temperate across all the plated through holes. The Tutorial Project includes a Thermal Map, but until now it has not been assigned to any Thermal Events.
To assign the Thermal Map, right-click the Thermal Map.csv entry located in the Files folder of the Project Tree and select the Edit Properties menu option. Since this file has already been successfully imported in the past, we know that all the properties, shown below, are correct.
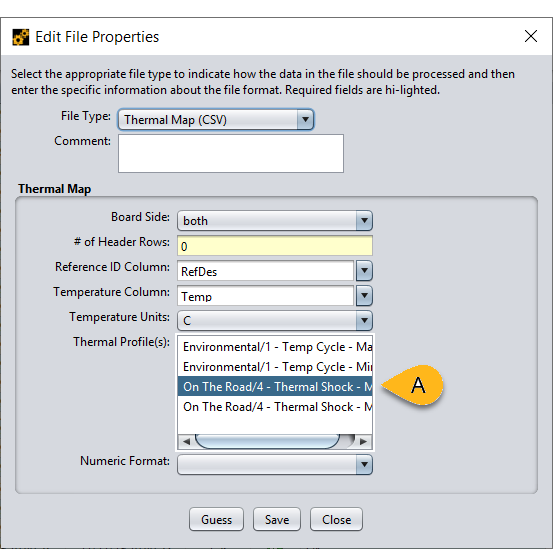
Our main focus, therefore, is on the Thermal Profile(s) property, which lists all of the Thermal Events defined in the project Life Cycle. In this case, we see Min and Max entries for both Thermal Events discussed above. The property dialog allows us to assign the selected Thermal Map to one or more of the Thermal Events, representing the minimum or maximum temperatures (or both). Once assigned, the temperatures defined in the Thermal Map itself will be used for those events, instead of the ambient values defined in the thermal cycle.
To see how this works, select the profile entry as shown (A, above) and press Save to assign the Thermal Map to that Thermal Event.
Since we've effectively changed one of the Thermal Events, all analysis results that depend on thermal properties will be cleared, including the PTH Fatigue Results. Therefore, you'll need to right-click the PTH Fatigue entry in the Project Tree and select Edit Properties. Since we have changed the Thermal Profile to “On The Road/4-Thermal Shock-Max,” we must also toggle the Thermal Event to On "The Road: 4-Thermal Shock" as shown below:
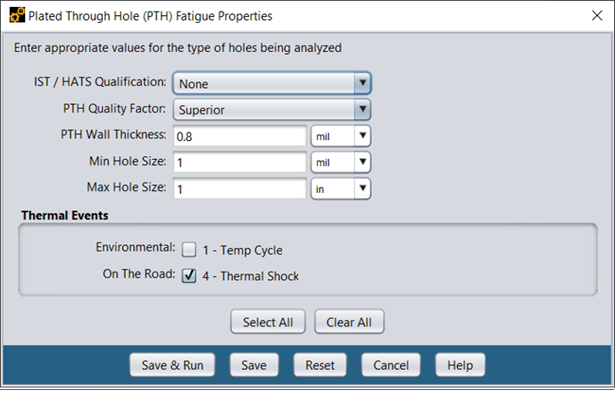
Afterwards, click Save &Run to run the analysis and generate the results. Displayed below is the Time to Failure Graph.
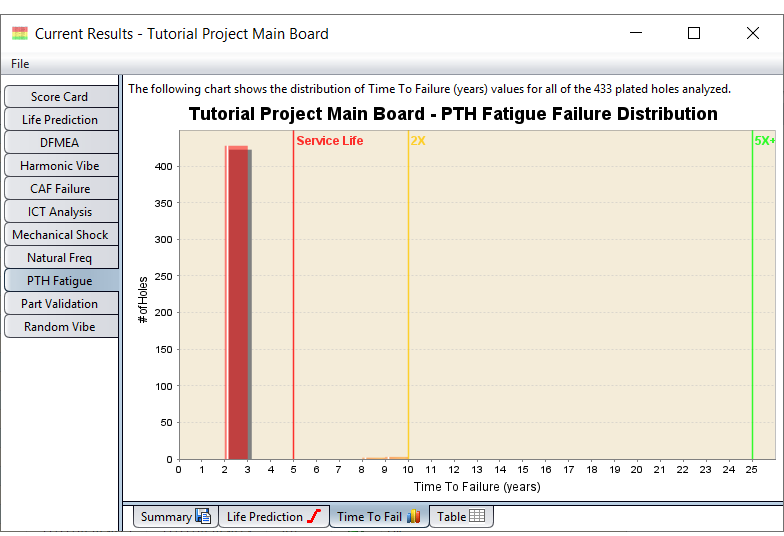
Now if we look at the Failure Distribution, we see most holes are expected to fail during the service life period.
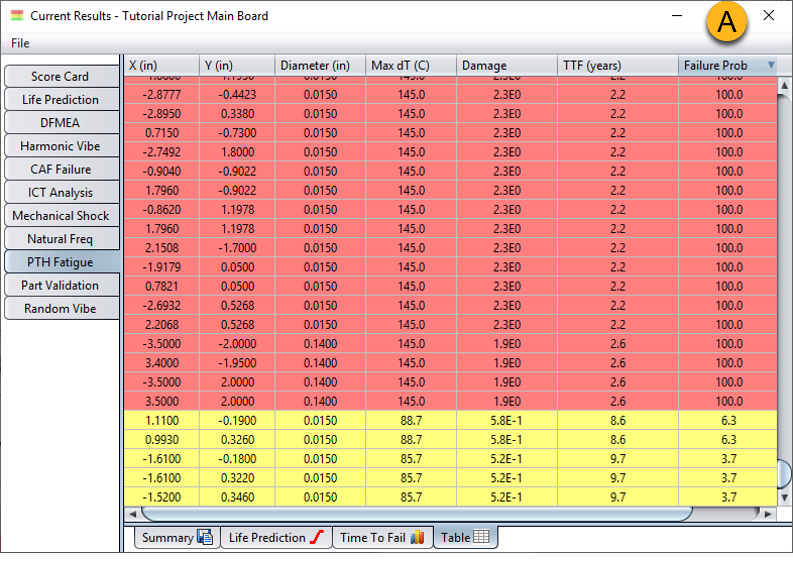
To get a more detailed view of what happened, select the Table sub-tab to see the analysis details for each hole analyzed. See image A below.
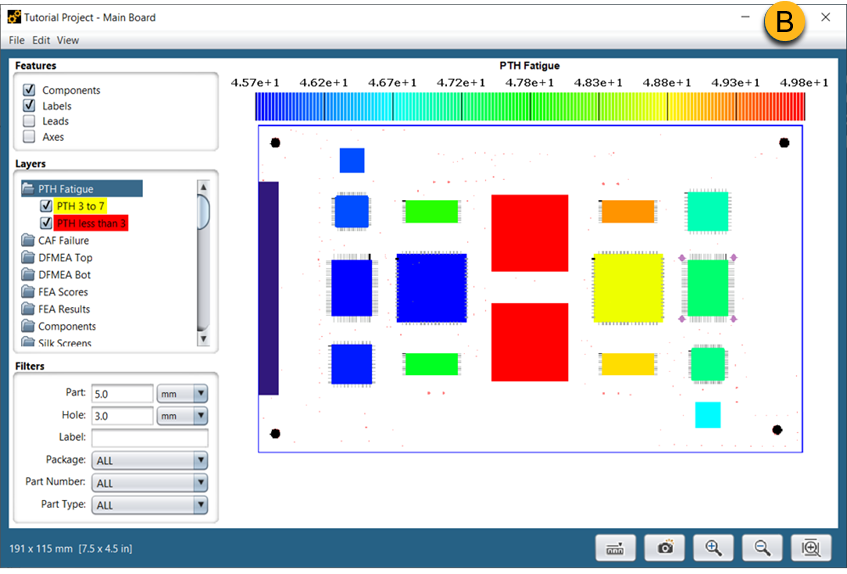
You may also overlay the PTH Fatigue Results with the Thermal Map in the Layer Viewer. To that end, double-click the Thermal Map.csv entry in the Project Tree to display the Thermal Map itself in the Layer Viewer. Then, double-click the PTH Fatigue folder in the Layer Viewer to overlay the PTH Fatigue results. Finally, double-click the Drill Holes entry to display holes that weren't analyzed. You may need to enter 0 in the Hole Filter to view all holes. The resulting display should look something like image B.
The Thermal Map defines uniform temperatures for a small number of circuit card components. The color coding shows the relative temperature of each component, from cool blue to hot red.
Note: If you hover the mouse over any of the colored regions, the associated temperature will be displayed in the upper left corner of the layer panel. That provides a convenient way to verify data and analyze results involving thermal properties.