Select > > .
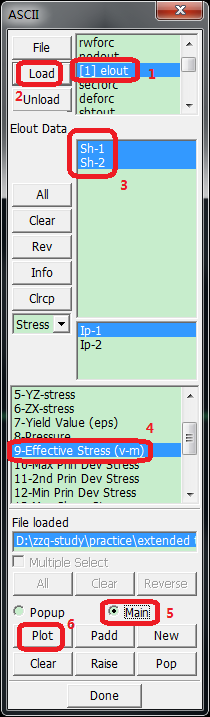
Select elout from the list.
Click (loads \implicit\elout).
Select Sh-1 and Sh-2 from the middle list (hold down Ctrl for multiple select).
Select 9-Effective Stress (v-m) in the bottom list.
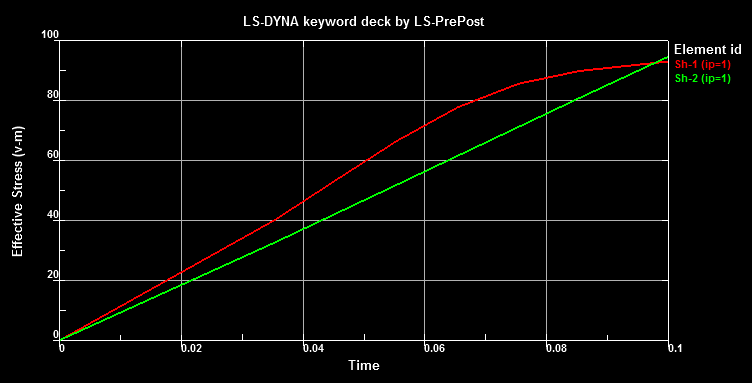
Click .
Click .
Click (located above the button in the side panel).
Open \explicit\elout.
Select Sh-1 and Sh-2 from the middle list.
Select 9-Effective Stress (v-m) in the bottom list.
Click .
Right-click in XY-plot Page Manager.
Click .
Click the icon of Set and change titles/axis labels.
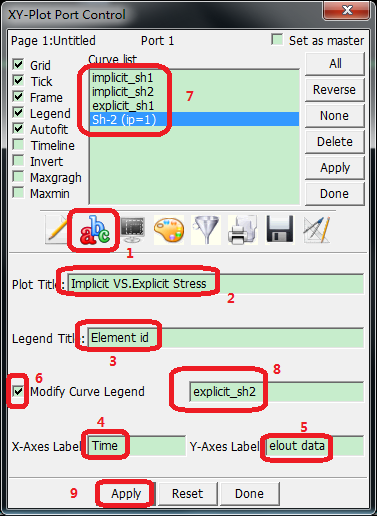
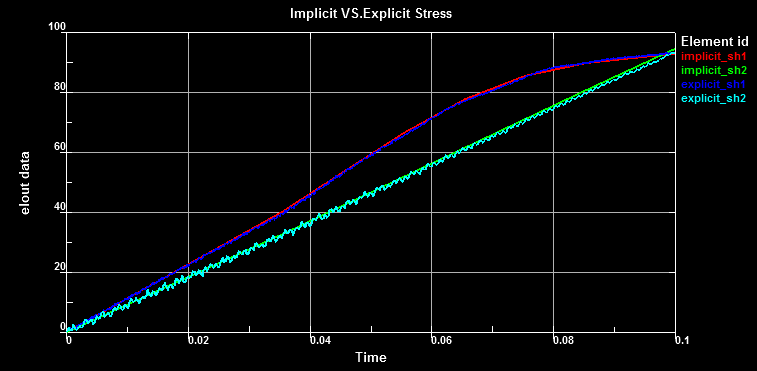
Enter Plot Title:
Implicit vs. Explicit Stress.Enter Legend Title:
Element id.Enter X-Axes Label:
Time.Enter Y-Axes Label:
elout data.Activate Modify Curve Legend.
Select Sh-1 (ip=1) and modify name to
implicit_sh1(click ).Select Sh-2 (ip=1) and modify name to
implicit
                        sh2
(click ).Select Sh-1 Effective Stress (v-m) (ip=1) and modify name to
explicit_sh1(click ).Select Sh-2 Effective Stress (v-m) (ip=1) and modify name to
explicit_sh2(click ).