


Some additional tools and commands that are available on the "toolbox" ( ) drop-down menu will open task
panels. Some commands on this menu, and their associated task panels, are only available
when viewing specific tabs.
) drop-down menu will open task
panels. Some commands on this menu, and their associated task panels, are only available
when viewing specific tabs.
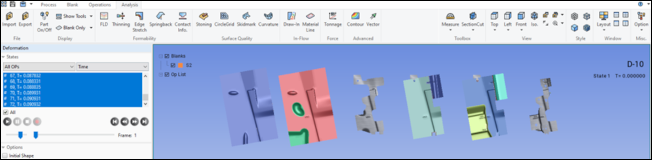
Open the Multi-Stage Model Layout task panel to display all
operations simultaneously in the graphics window. Access this task panel by choosing
from the ( ) drop-down menu in the main
toolbar. This task panel is only available during postprocessing analysis.
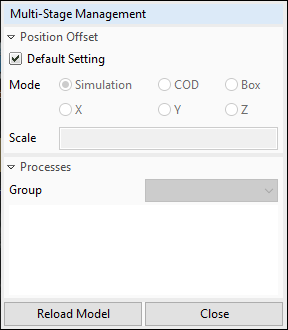
Choose the layout mode and click to display all stages of the process simultaneously.
The default mode is . To change mode, un-check
the box next to Default Setting and choose another mode. Switch
to mode and enter a Scale (default
is 100) to view each stage side by side.
If you are performing a Trim Line Development simulation type, use the drop-down menu to specify the iteration you want to display. The default group is the initial iteration.
When you are finished with the multi-stage view, click .
Use the Blank Tool Position Check task panel to check the
position of the blank against the tooling. Access this task panel by choosing
from the ( ) drop-down menu in the main
toolbar. This task panel is only available during postprocessing analysis.
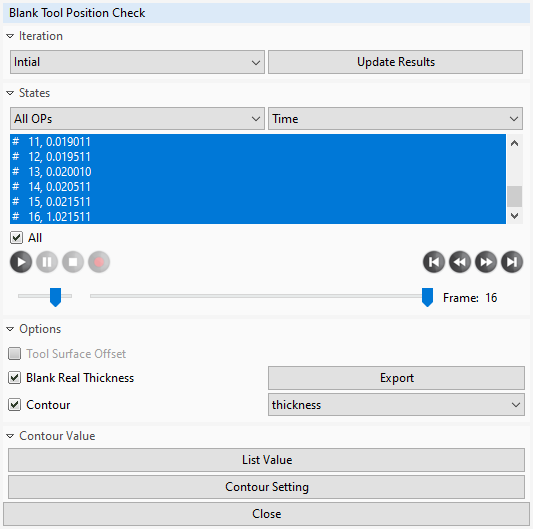
If the contact offset (see OP Setting Task Panel) is a defined offset, tools will be shown as closed without gap in normal post processing. If you want to inspect the offset, activate Tool Surface Offset to offset the tools in post-processing. This option can only be activated when contact offset is defined. If the model has geometrical offset, this option will be greyed out.
The blank is modelled with shell elements. It contains thickness information but the software not show the geometry as a volumetric model in normal post-processing. If thickness information is needed, activate Blank Real Thickness to see the expanded shell with real thickness. The shape of the blank can be exported as an STL file.
The Contour option shows the thickness distribution after forming in a 3D body. Currently, only thickness is supported as a contour plot here.
When you are finished with the tools on the Blank Tool Position Check task panel, click .
Display the Blank Outline task panel, and generate the
outline of a blank by picking lines you have drawn or imported. Access this task
panel by choosing from the
( ) drop-down menu in the main
toolbar. This task panel is only available during postprocessing analysis.
Use the Node Trace task panel trace a selected node and show
the history of its position. The trace can be exported as an IGES file for further
usage.. Access this task panel by choosing
from the ( ) drop-down menu in the main
toolbar. This task panel is only available during postprocessing analysis.
Use the Export Part Boundary task panel to select parts,
generate a boundary geometry, and output the boundary to an IGES Data file. Access
this task panel by choosing from the
( ) drop-down menu in the main
toolbar. This task panel is only available during postprocessing analysis.
Open the User View task panel, and use it to create, delete,
recall, import, and export user view settings. Create a view at any time, then
recall it later. Access this task panel by choosing from the ( ) drop-down menu in the main
toolbar.
To create a new view from the current view settings, enter a meaningful name in the View Name field and click . This adds the name you entered to the View List.
To apply a view from the list to the graphics window, click the view's name in the View List to select it, and click .
To save a view in the View List to a View Data File:
Click the view's name in the View List to select it.
Click to open a file browser.
Navigate to a memorable location. It is best to use a central location, and not a specific project directory.
Enter a File name, and click .
To load the exported view into another project:
Open the other project.
Click to open a file browser.
Navigate to the location of the View Data File (this will be a .xml file) and select it.
Click .
The View List shows the saved view, and it can be selected and recalled into the current graphics window.
When you are finished with the User View task panel, click to remove it from the window.
Utilize the Create Curves task panel to draw a multi-point line on the blank for use with other analysis tools such as the Viewing Skidmarks and Viewing Material Lines post-processing tools. This task panel is only available during postprocessing analysis.
Display the Identify task panel, which enables you to label
individual nodes, elements, and parts in the model by clicking in the graphics
window or by entering the ID of an item. This tool is most useful when you are
creating images to use in reports or presentations, or reviewing output data and
want to locate a specific item of interest. Access this task panel by choosing
from the
( ) drop-down
menu in the main toolbar.
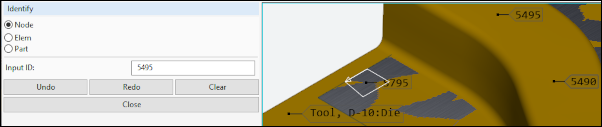
First, choose Node, Elem, or Part to indicate which type of item you wish to identify.
Then, move the mouse pointer over the geometries in the graphics window. Items (depending on your choice) will be highlighted when they are under the pointer. Click the highlighted item to display a label with that item's ID. If you identify a part that is a Tool, the label will also show the operation that utilizes that tool. If you identify a part that is a Blank, the label will also show the material of that blank and the blank's thickness.
If you know the ID number of an item, but not where it is located in the model, enter the ID in the Input ID field and press Enter. A numbered label will mark the location of that item.
Click to remove the most recently added label. Click to replace an incorrectly removed label. Click to remove all labels from the graphics window.
When you are finished with the Identify task panel, click to remove it from the window.
After running the simulation, use the Summary task panel to view a summary report of the simulation that includes the number of operations, number of elements, tool movements, forces, and compute time for the individual operations.
Choose from the
( ) drop-down
menu to display the Summary task panel. This task panel is only
available following a run of the simulation, during postprocessing analysis.
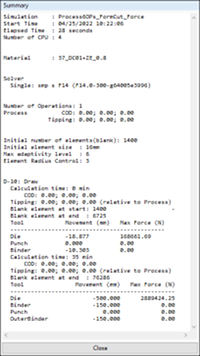
You can highlight text in the summary using the mouse pointer, just as in most text editors. Right-click in the task panel to display a context menu of Summary-specific commands such as and , and display options such as right-to-left reading order and Unicode character commands.
When you are finished with the Summary task panel, click .
For more information about the data contained in the summary, see Viewing a Simulation Summary.