


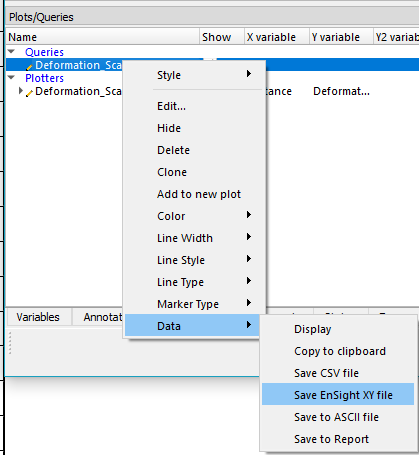
The EnSight XY Query Data format (suffix .exy) is useful to save an xy query from EnSight. The data is saved into this format by right clicking on a query (or queries) and choosing to , as shown in Figure 10.8: Saving an EnSight XY File. Since this format does not support transient data, saving a transient query results in a file for each chosen query for each timestep. The file can contain one or more curves. The following is an example XY Data file:
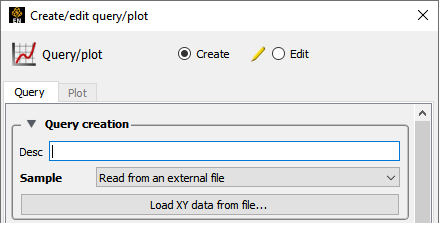
Individual .exy files can be read in using the query dialog. Click on the Query icon.

In the resulting Create/Edit Query/plot dialog, choose Sample → and click on Using this methodology, you can load one, static dataset. There is currently no way to recreate the transient XY query by reading from the multiple static files.
| Line | Contents of Line | |
|---|---|---|
| 1 | 2 | |
| 2 | Distance vs. Temperature for Line Tool | |
| 3 | Distance | |
| 4 | Temperature | |
| 5 | 1 | |
| 6 | 5 | |
| 7 | 0.0 | 4.4 |
| 8 | 1.0 | 5.8 |
| 9 | 2.0 | 3.6 |
| 10 | 3.0 | 4.6 |
| 11 | 4.0 | 4.8 |
| 12 | Distance vs. Pressure for Line Tool | |
| 13 | Distance | |
| 14 | Pressure | |
| 15 | 2 | |
| 16 | 4 | |
| 17 | 0.00 | 1.2 |
| 18 | 0.02 | 1.1 |
| 19 | 0.04 | 1.15 |
| 20 | 0.06 | 1.22 |
| 21 | 3 | |
| 22 | 1.10 | 1.30 |
| 23 | 1.12 | 1.28 |
| 24 | 1.14 | 1.25 |
Line 1 contains the (integer) number of curves in the file.
Line 2 contains the name of the curve.
Line 3 contains the name of the X-Axis .
Line 4 contains the name of the Y-Axis .
Line 5 contains the number of curve segments in this curve.
Line 6 contains the number of points in the curve segment.
Lines 7-11 contain the X-Y information.
Line 12 contains the name of the second curve.
Line 13 contains the name of the X-Axis
Line 14 contains the name of the Y-Axis
Line 15 contains the number of curve segments in this curve. (For the second curve, the first segment contains 4 points, the second 3 points.)