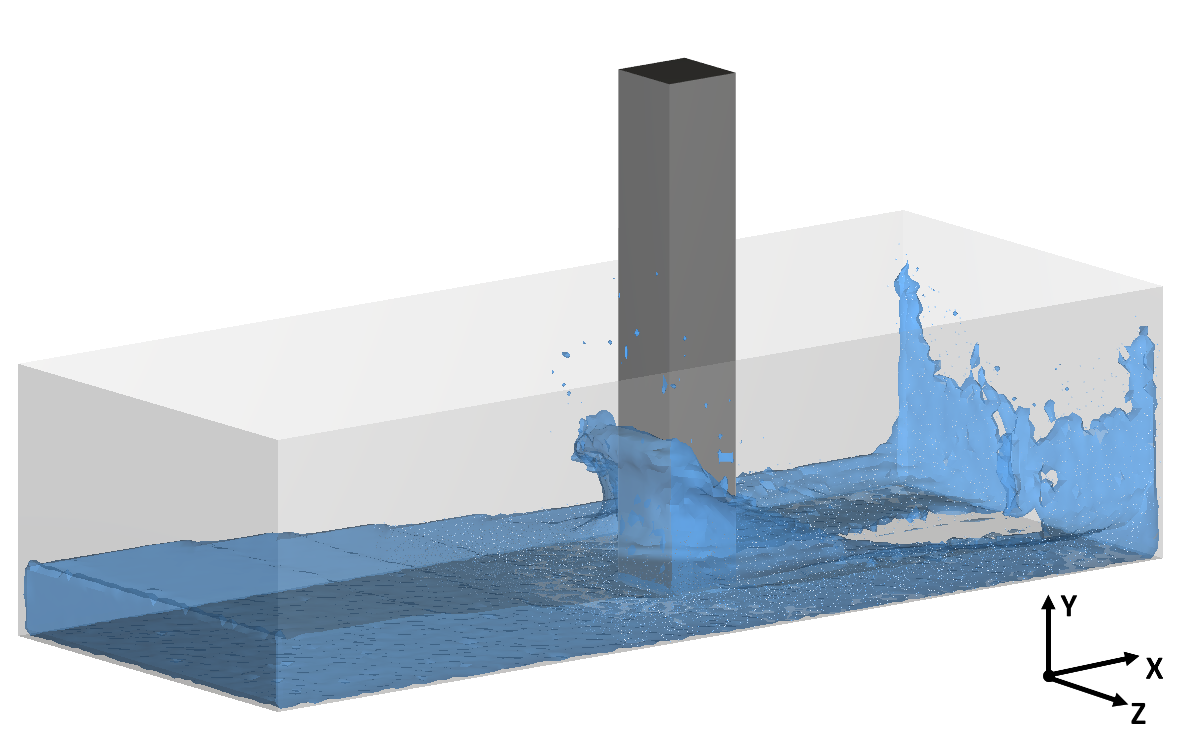
In this validation case, part of a container is filled with water. After some time, the gate is removed, allowing the water to flow through the container. The water hits a square column placed in the middle of the container and the resultant force on it is compared to experimental data available in [6].
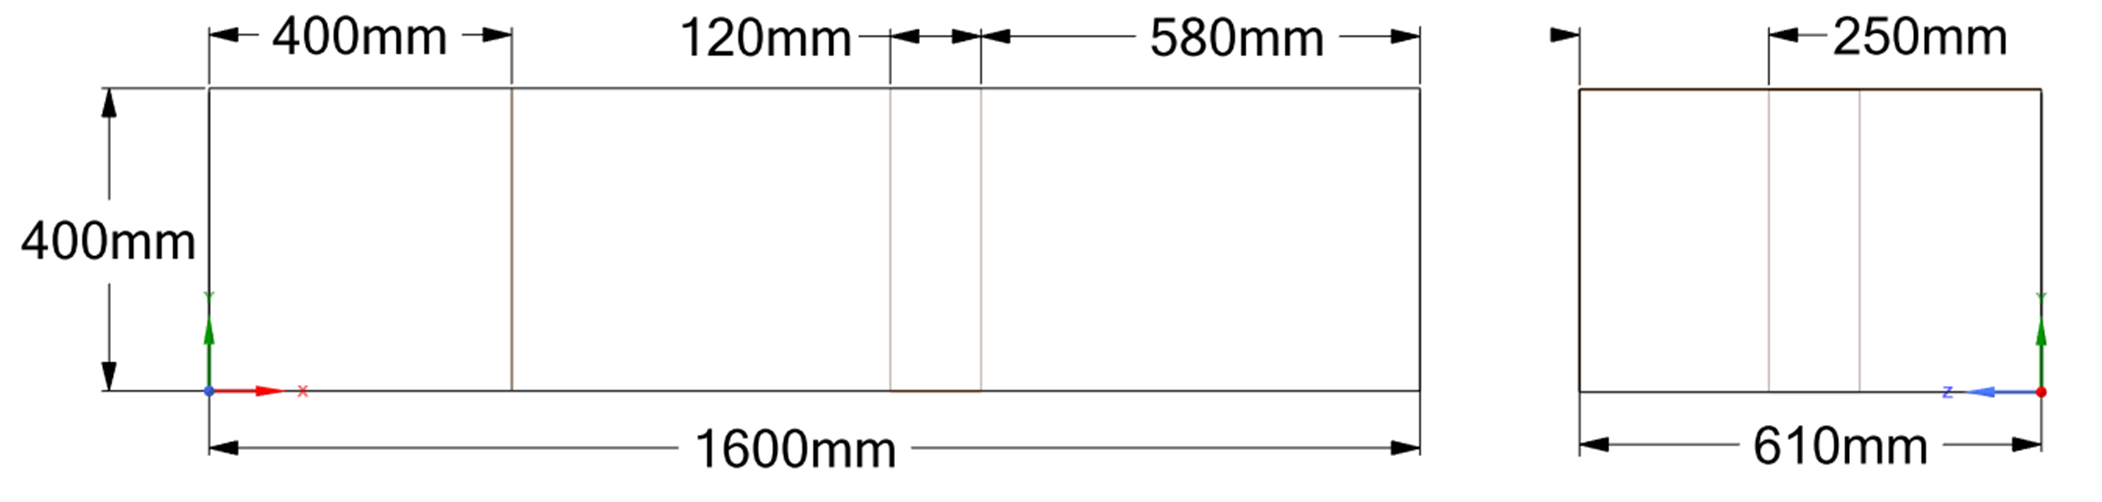
The dam break validation case is illustrated in Figure 4.1: Dam break validation case. and the geometries dimensions are shown in Figure 4.2: Geometries dimensions..
The input parameters for this validation case setup are listed in Table 4.1: Validation case input parameters..
Table 4.1: Validation case input parameters.
| Parameter | Value | Unit |
|---|---|---|
| Physical Model: | ||
| Gravity | 9.81 |  |
| Fluid Properties: | ||
| Element size | 5 |  |
| Initial Density | 1000 |  |
| Dynamic Viscosity | 0.001 |  |
| Sound Speed | 20 |  |
| Boundary Type | No Slip Laminar | - |
| Turbulence Type | LES | - |
| Viscosity Type | Cleary | - |
| Positions Correction Type | Shift | - |
| Volumetric Fill Mass | 73 |  |
Comparing the results, the overall behavior of the fluid force acting on the column calculated by Rocky matches the experimental results developed by [6]. In the experiment, the force was measured with a load cell mounted inside the column at its bottom. In the simulation, the force is the sum of the normal forces acting on each column geometry triangle in the X direction.
The comparison of the simulation and experimental forces acting on the column over time is shown in Figure 4.3: Comparison of the force acting on the column.. The absolute error at peak force is around 2 N (33.3 N experimental versus 31.2 N from the simulation), which represents a relative error of 6.3%. it is important to notice that the main characteristics of the experiment are present in the simulation, so the experimental curve is well fit for most of the simulation time.
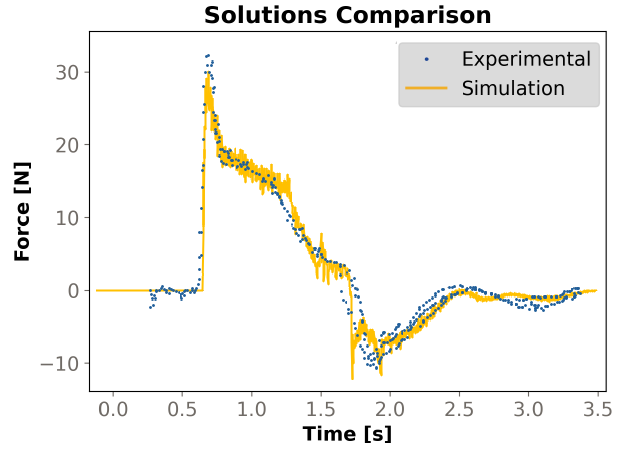
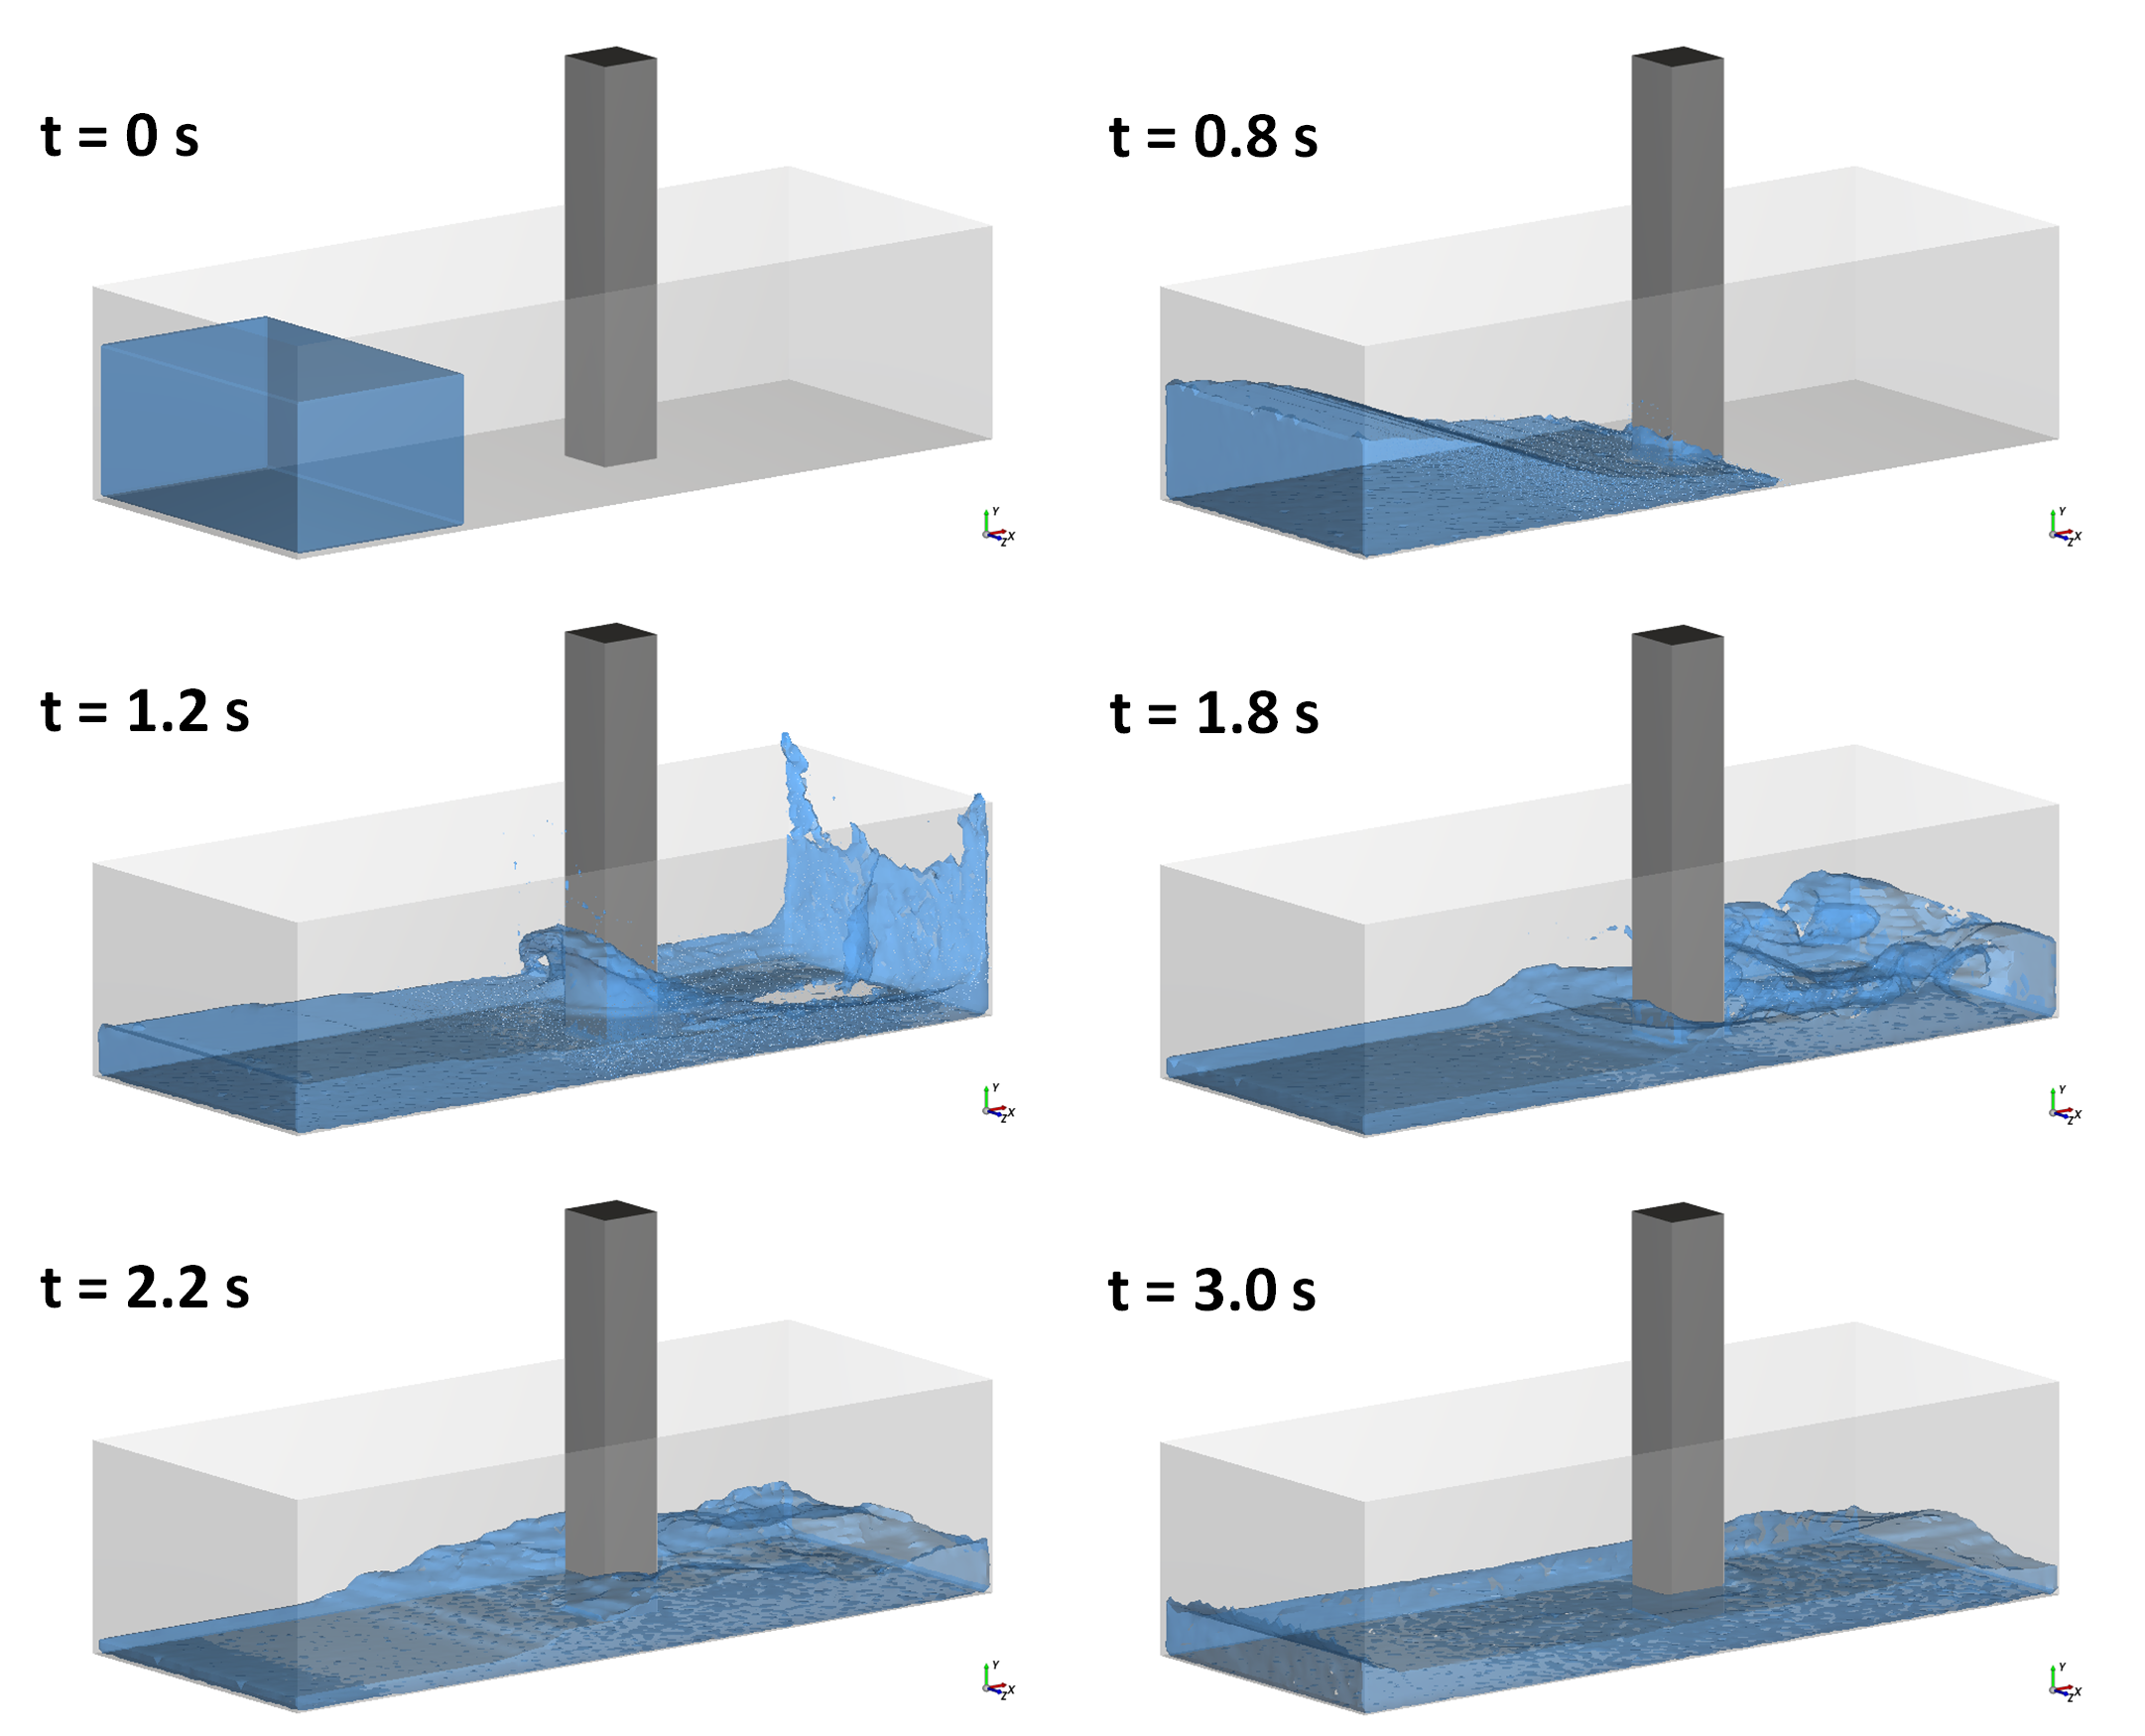
Figure 4.4: Simulation 3D results showing the wave impact on the column. shows the wave evolution over the time obtained by the simulation. The first frame shows the initial condition, right before the gate removal. The first wave impact occurs around 0.8 s (positive peak force of Figure 4.3: Comparison of the force acting on the column.) and the second wave impact occurs at 1.8 s (negative peak force of Figure 4.3: Comparison of the force acting on the column.).