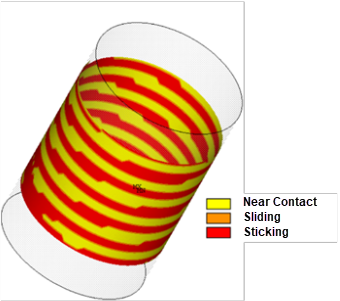
The main cause of bolt self-loosening is external excitation. Amplitude, frequency, and direction specify the external excitation. The problem is solved for three excitation magnitudes (0.1,0.15, and 0.20 mm) at three different excitation frequencies (10, 110, and 650 Hz) for each direction. A simplified bolt thread model is used to model nut-bolt threads to avoid a detailed geometric modeling of threads. Figure 71.7: Contact Status of the Simplified Bolt-thread Model shows the contact status of the threaded part.
The effect of different parameters on the bolt self-loosening is studied. The following topics are available:
Characteristic of bolt self-loosening curve for 27 loading cases.
Effect of fretting wear on the bolt self-loosening.
Effect of local dynamics (frequency dependence) on the bolt self-loosening.
Self-loosening curves characterize bolt self-loosening behaviors for a particular loading excitation over a number of cyclic loadings. A self-loosening curve can be characterized into three stages:
Stage-1: rapid reductions in the pretention load due to smoothening of asperities/protrusion plastically and redistribution of stress in engaged threads. Stage-1 spans over a few hundred cycles as can be seen in Figure 71.8: Bolt Self-loosening Curve for the Different Loading Cases If rate dependent models (wear/creep) are not used, no further reduction in the pretention is possible.
Stage-2: An adaptive scaled wear model is used that predicts continual decrease in the pretention load.
Stage-3: Pretention load sharply decreases and results in fatigue fracture.
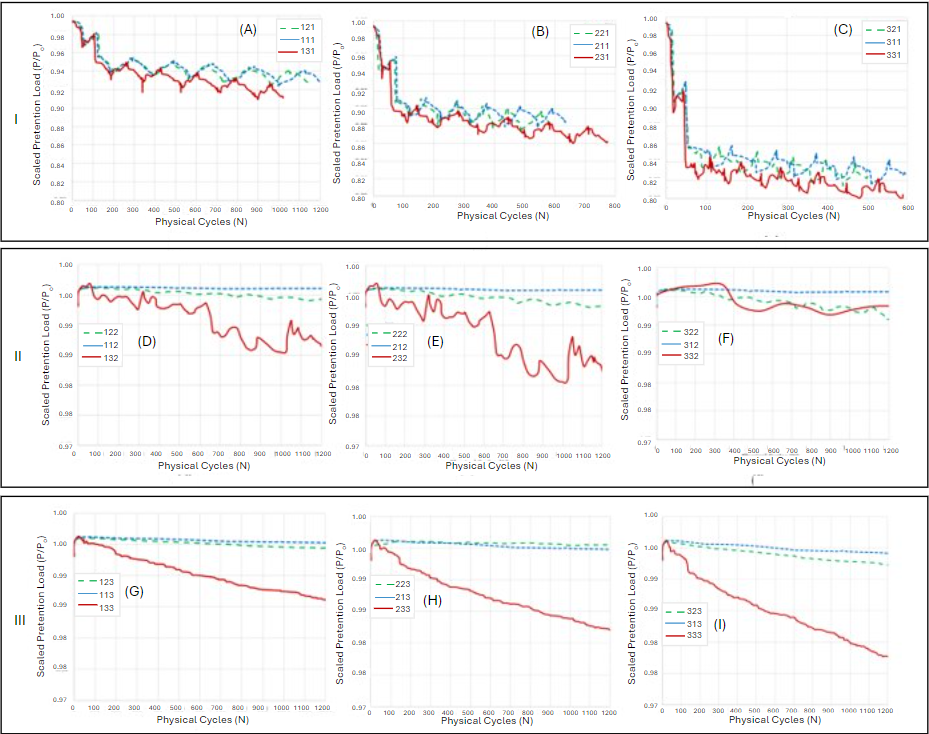
A simulation for only 6 cycles is performed, and that includes the wear effect of thousands of cycles and a slow Stage-2 loosening is modeled effectively. Twenty-seven load cases are considered to see the effect of magnitude, frequency, and direction of an external excitation on the bolt self- loosening for a lap joint. From bolt-loosening curves of 27 load cases (Figure 71.8: Bolt Self-loosening Curve for the Different Loading Cases), the following observations could be made:
Lateral direction excitation (case a, b and c) results in severe bolt loosening as experimentally observed. Junker’s test facility simulates lateral direction excitation.
Initial stress-redistribution loss depends on the magnitude of the excitation only for the lateral excitation.
Continual decrease of pretention depends on the magnitude of applied excitation for Stage-2.
Pretention reduction is more when excitation frequency is closer to the natural frequency of the bolt-joint assembly.
A larger magnitude of excitation results in faster continual self-loosening. A Larger applied sliding stroke results in larger wear rate for the same frequency and excitation direction, as is seen in the following figure where I, II, and III are:
| I: Transverse excitation-X: (a), (b), and (c) |
| II: Axial excitation-Y: (d), (e), and (f) |
| III: Lateral excitation-Z: (g), (h), and (I) |
The legend ijk, I, j, and k represent the magnitude, frequency, and direction of an excitation respectively.
For a smaller sliding stroke, wear scaling is more aggressive. Wear scaling is adaptive and user intervention is not required to set a wear scaling factor for each sliding stroke. Only one specification for the scaling factor is used for all sliding strokes. Sharp corners and irregular points are removed in the few loading cycles and drastic bolt self-loosening is observed. Rate independent plasticity reduces pretention only in the initial cycle. For modeling Stage-2, a wear/creep model is needed. Creep is important when gaskets are used for the bolted joint. For the metallic joint, scaled wear is effective to model the slowly reducing pretension in Stage-2.
Average wear depth for a contact pair can be estimated as:
 | (71–1) |
where,  is volume wear loss at a contact pair and
  is the contacting area of the contact pair available in the contact
database file (cnd) and non linear history tracker file
(nlhist). Wear is added up for all surfaces to calculate the effective
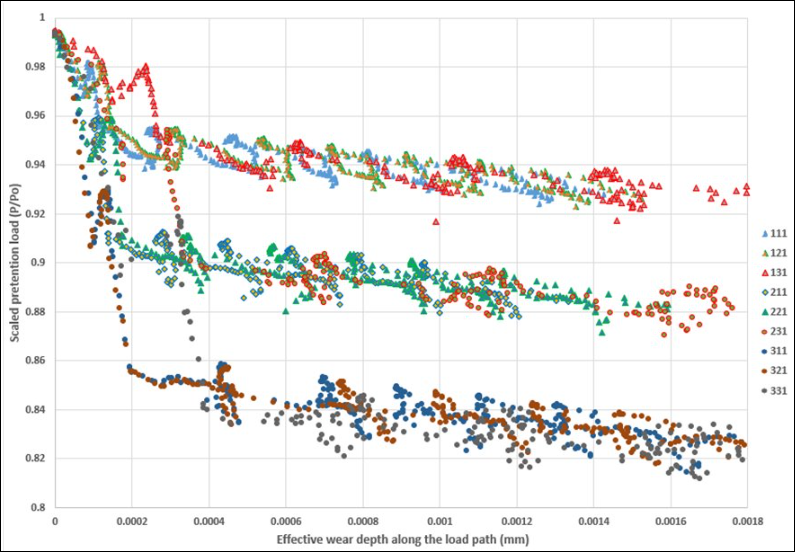
wear depth along the bolt load path. The effective wear and the pretention loss is plotted
for the lateral loading case in the following figure. The figure shows a strong correlation
between wear and self-loosening for Stage-2.
is the contacting area of the contact pair available in the contact
database file (cnd) and non linear history tracker file
(nlhist). Wear is added up for all surfaces to calculate the effective
wear depth along the bolt load path. The effective wear and the pretention loss is plotted
for the lateral loading case in the following figure. The figure shows a strong correlation
between wear and self-loosening for Stage-2.
Figure 71.9: Bolt Self-loosening Curve as Function Accumulated Wear Along the Bolt Load Path the Transverse Excitation in X direction, for Three Magnitudes (0.1,0.15 and 0.20 mm) and Excitation Frequencies (10,110 and 650Hz). Legend ijk, I, j and k Represent Magnitude, Frequency and Direction of the Excitation, Respectively
A quantitative estimate of bolt-self loosening can be made. The distance dilation due to wear at pth contact pair for N cycles can be estimated as:
 | (71–2) |
Where, P, ui, Ap, kpc, kpt, and Spi, are the preload, magnitude of the excitation, contacting area, wear coefficient of the contacting surface, wear coefficient of the target surface, and influence factor of the contact pair. The influence factor depends on the excitation direction and frequency, and is used for the estimation of accumulated slip at the contact pair. Total distance dilation on the load path due to wear is additive and
 | (71–3) |
Pretention load in the bolt shank could be estimated as:
 | (71–4) |
Pretention load for Nth cycle could be estimated as:
 | (71–5) |
where, A, L, ϵsr, and ϵp are the cross-sectional area of the bolt shank, effective length of the bolt shank, stress redistribution strain, and plastic strain. The influence factor Spi can be estimated using the geometric compatibility condition or the experimental value. Equation 71–5 provides an estimate for the continual decrease of prestress with number of cycles N.
From Figure 71.8: Bolt Self-loosening Curve for the Different Loading Cases it is evident that the bolt loosening occurs at a faster rate when excitation frequency is near the natural frequency of the bolted joint. Near the natural frequency, bolt loosening may occur even for an axial/transversal excitation. Excitation frequency has no effect on the stress-redistribution / Stage-1 pretention loss.
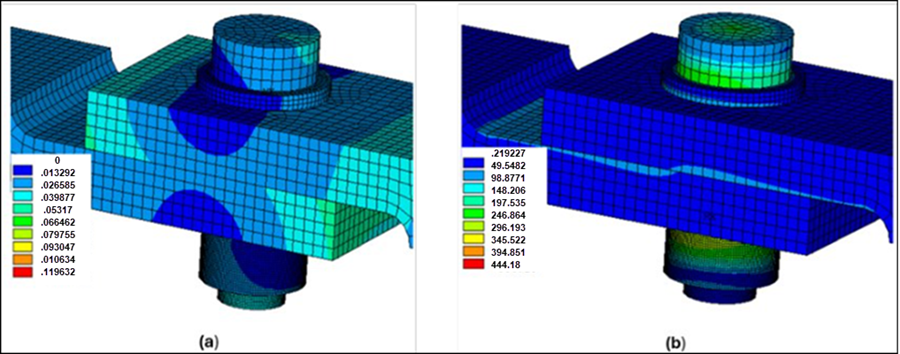
Figure 71.10: Magnified View for the Displacement (a) and von Mises stress (b) at the Last Sub-step for the 0.20 mm Displacement 10 Hz Frequency in the X-direction Excitation