


The following figure shows the total reaction force versus the maximum vertical displacement at the center of the concrete slab for both concrete material models:
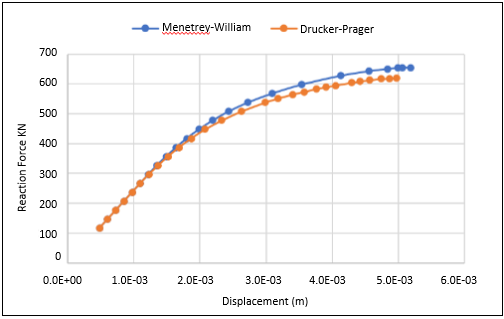
The load-limit analysis finds a loss of numerical convergence, also identifiable as the horizontal tangent of the resulting load/displacement curve, at a maximum total force of approximately 620 kN (using Drucker-Prager) or 655 kN (using Menetrey-William). At these load limits, the structure collapses at a maximum deflection of approximately 4.98 mm (Drucker-Prager) or 5.08 mm (Menetrey-William).
Note: Since the load limit is identified by the loss of convergence, you may have to clear results and solve again if you are opening and resuming the *.wbpz file to view the evaluated results.
Figure 49.7: Vertical Displacement After Applying Dead Load (A) and Load Limit (B), Drucker-Prager Model
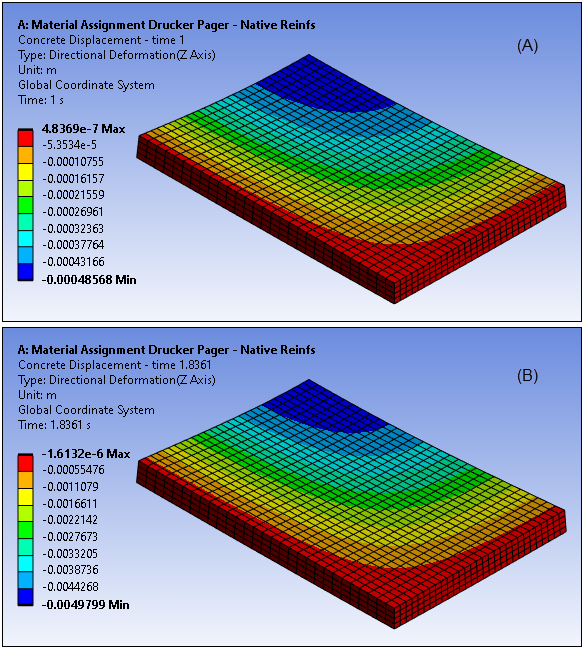
Figure 49.8: Vertical Displacement After Applying Dead Load (A) and Load Limit (B), Menetrey-William Model
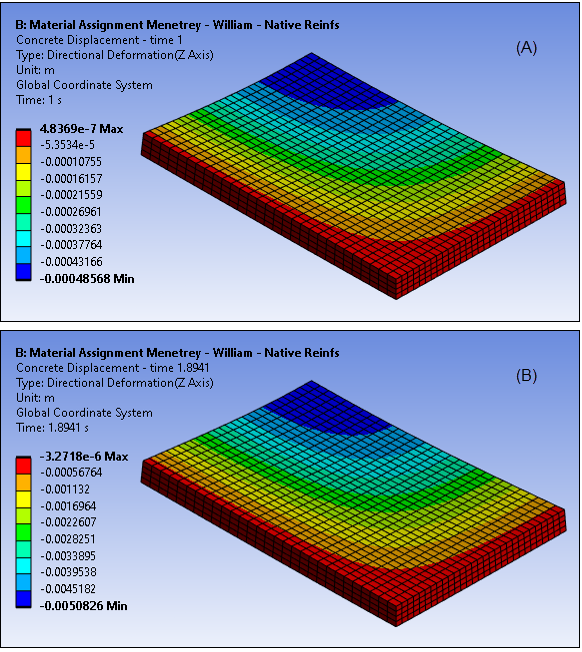
The application of the load limit results in an ultimate displacement approximately ten times larger than the at-rest deformation state. For both loading conditions, the maximum displacement is found in the center, consistent with theoretical assumptions.
Figure 49.9: Horizontal Stress Component (SY) at Ultimate Limit Load ,Top (A) and Bottom (B) View, Drucker-Prager Model
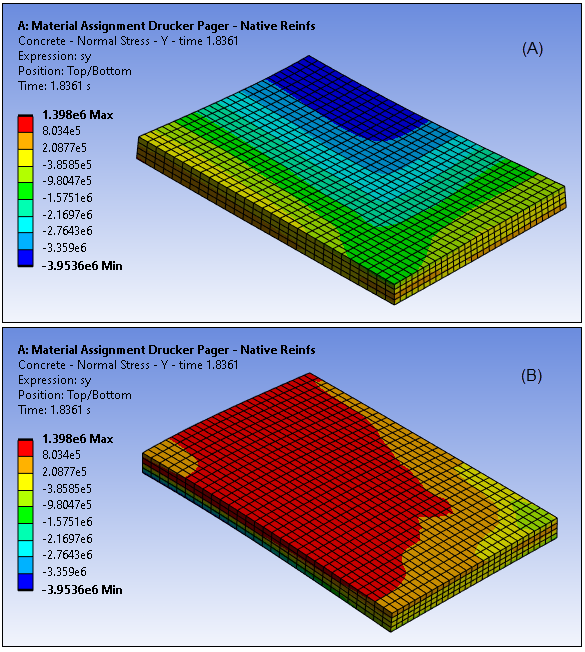
Figure 49.10: Horizontal Stress Component (SY) at Ultimate Limit Load ,Top (A) and Bottom (B) View, Menetrey-William Model
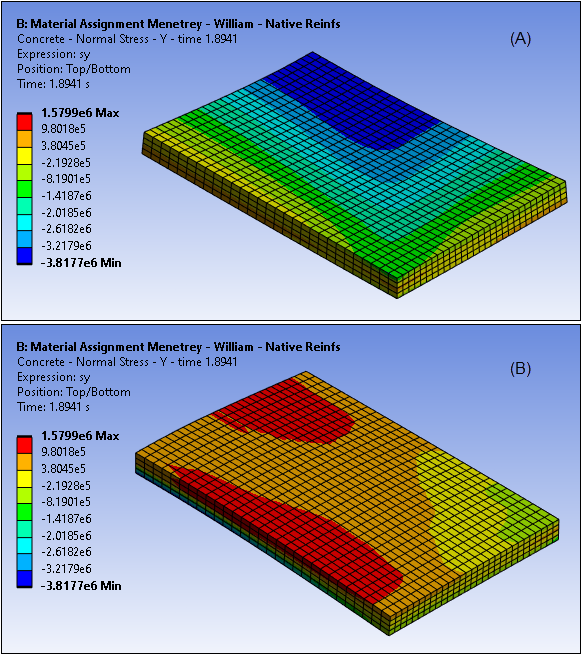
Figure 49.11: Horizontal Stress Component (SX) at Ultimate Limit Load ,Top (A) and Bottom (B) View, Drucker-Prager Model
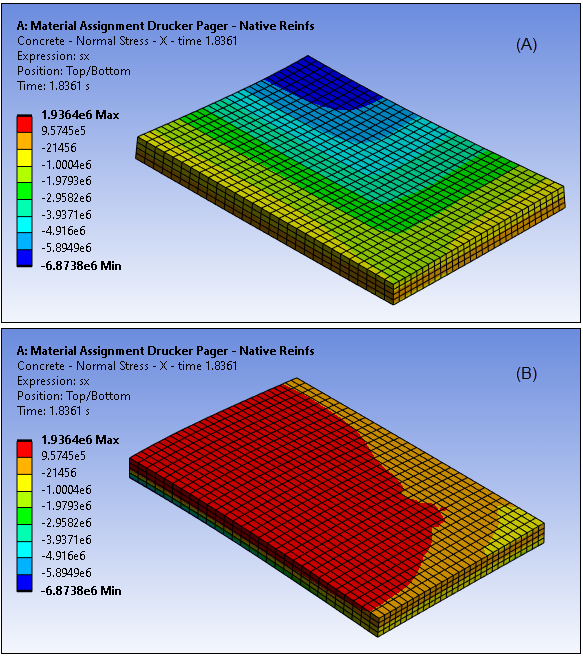
Figure 49.12: Horizontal Stress Component (SX) at Ultimate Limit Load ,Top (A) and Bottom (B) View, Menetrey-William Model
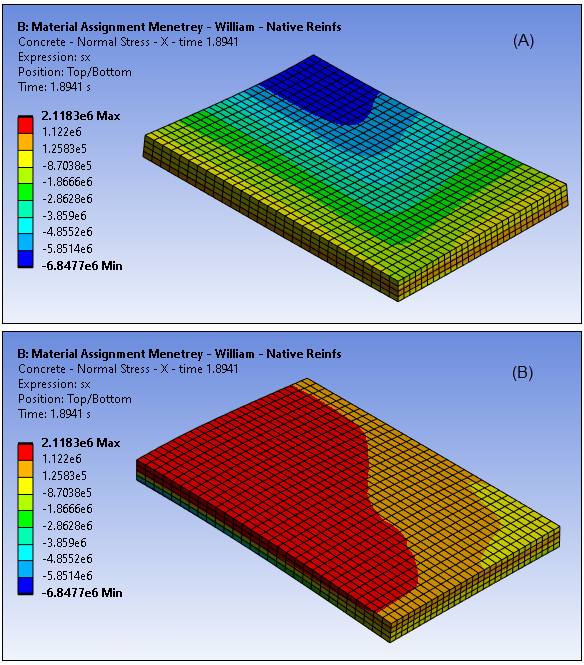
Figure 49.13: Stress Component (SX) Reinforcements (Top View): Drucker - Prager (A), Menetrey - Willam (B) Model
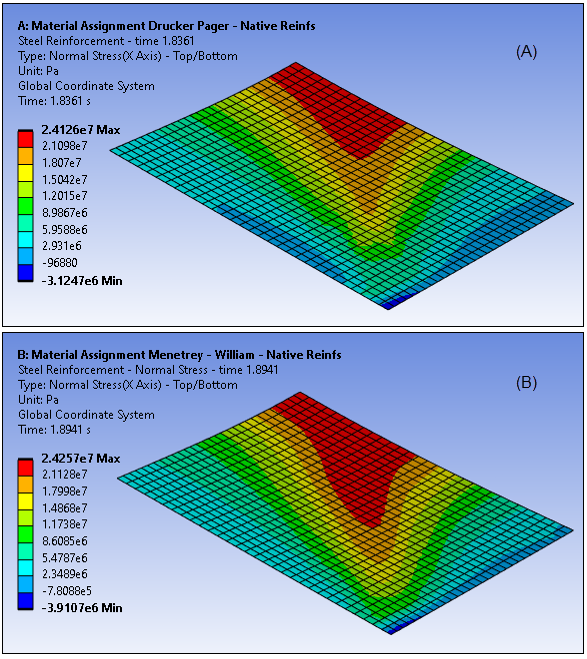
The steel reinforcing supports the composite structure by carrying part of the loading. The increasingly large tensile stresses in the concrete domain lead to crack deformation, as indicated by the equivalent plastic strains:
Figure 49.14: Equivalent Plastic Strains Concrete: Drucker - Prager (A), Menetrey - William (B) Model (Bottom View)
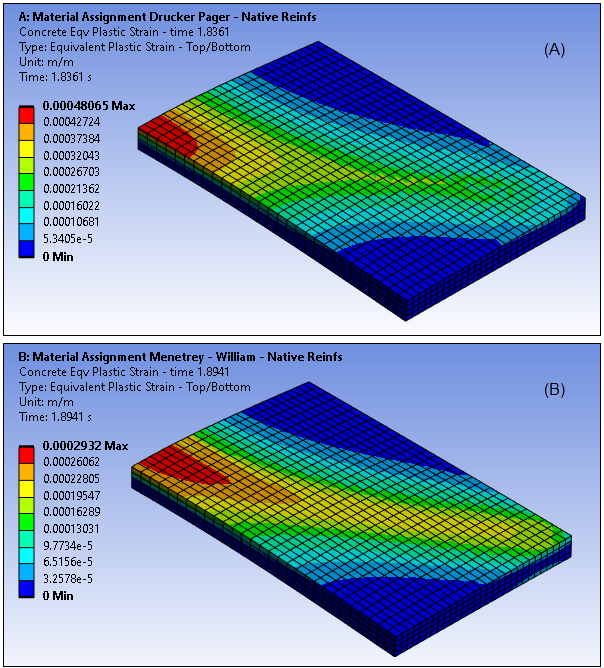
The crack pattern forms in the center and spreads towards the outermost edge. The loss of structural integrity due to crack formation leads to the collapse of the structure for the indicated load limit of 620 kN (Drucker-Prager) or 655 kN (Menetrey - William).