The following figure shows a contour plot of the deformation and strain energy at the end of simulation. The plot offers a general idea of the overall deformation of the specimen.

Except for the clamp regions, the deformation shows a uniform pattern in the gage region along the axis of twisting. Perpendicular to the axis of twisting is a large strain-energy near the outside edge of the specimen, decreasing toward the center.
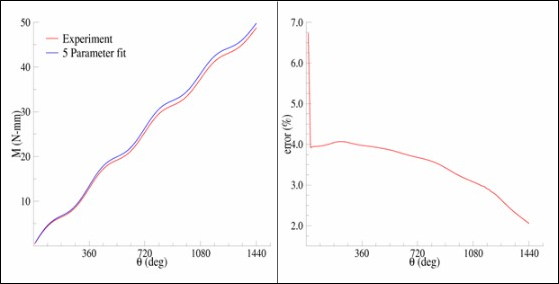
To plot moment vs θ, calculate moment reactions scoped to front right and back right clamp regions. The summation of both moment reactions gives the results plotted below.