VM-EXD-MECH-014
VM-EXD-MECH-014
Propagation of Shock and Rarefaction Waves in a Shock Tube
Overview
| Reference: | Harlow, Francis H. et al., Fluid Dynamics – A LASL Monograph, LA-4700, June 1971. |
| Analysis Type(s): | Explicit Dynamics 3-D |
| Elements: | Multi-Material Euler Quad |
| Boundary Conditions: | Default Wall |
| Structural Interactions: | No |
| Fluid-Structure Interactions: | No |
| Bonds: | No |
| Materials: | Ideal Gas |
Test Case
A 1000 mm (1000 element) shock tube is divided into two sections by a diaphragm at its
midpoint. Initially, gas is at rest on both sides. To the left of the diaphragm, the gas is
initially at a higher density and pressure than on the right
. Both sides of the diaphragm have the same internal energy
.
At t = 0, the diaphragm is removed and the gas in the tube is observed. A shock is observed moving from left to right, as well as a contact discontinuity moving from the left to the right, and a rarefaction wave moving from the right to the left.
There is no significant length to the system. The appearance of the system at a later time is a magnification of an earlier appearance (similarity solution).
Analysis Assumptions and Modeling Notes
Two interacting parts are created, one part is assigned a material with Euler inflow properties and the other ideal gas properties. The parts are then made to interact The initial conditions for the ideal gas in both shock tubes are:
|
γ = 1.4 | |
| ρ- = 0.01 gm/cc | ρ+ = 0.001 gm/cc |
| p- = 1000 MPa | p+ = 100 MPa |
| I0 = 2.5E5 J/Kg | λ = ρ-/ρ+ = p-/p+ = 10 |
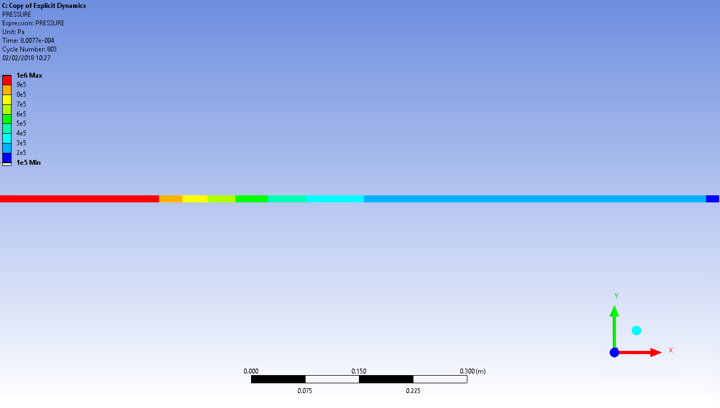
The calculation is run to t = 0.8 ms, the time at which the shock front nears the right boundary.
Results Comparison
Applying the theoretical solution to the initial conditions used for the simulation, the following values are obtained:
| Final pressure in tube: |
| Density of gas on left of diaphragm: |
| Density of gas on right of diaphragm: |
| Continuous pressure: |
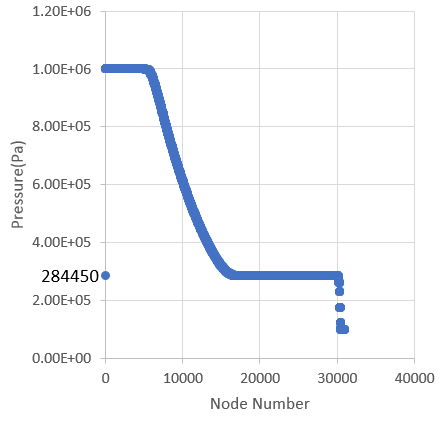
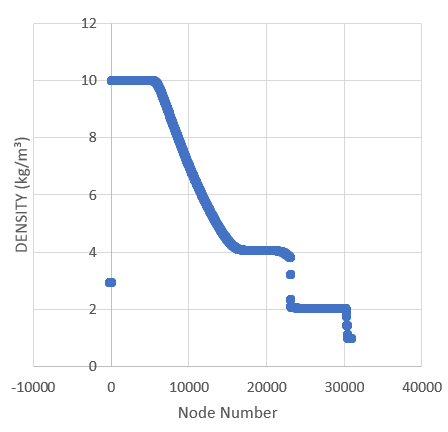
Pressure and density profiles along the length of the shock tube at the end of the
calculation show that the theoretical values are accurately predicted. The graph is produced by
exporting the results from the user-defined function PRESSURE and is plotted
against node number to show the pressure distribution at the end time:


