


VM-AQWA-MECH-002
VM-AQWA-MECH-002
RAOs for Hydrodynamic Diffraction System and Natural Modes for Hydrodynamic
Response
Overview
| References: |
Malenica, S., Zalar, M.& Chen, X.B. (2003). Dynamic coupling of seakeeping and sloshing. Proceedings of the International Society of Offshore and Polar Engineers (ISOPE). 1 (1), 1-7. Molin, B., Remy, F., Rigaud, S., & Jouette (de), Ch. (2002). LNG-FPSO's: Frequency domain, coupled analysis of support and liquid cargo motions. Proceedings of the International Maritime Association of the Mediterranean (IMAM) Conference. Greece. 1-8. |
| Analysis Type(s): | Aqwa Hydrodynamic Diffraction and Hydrodynamic Response |
Test Case
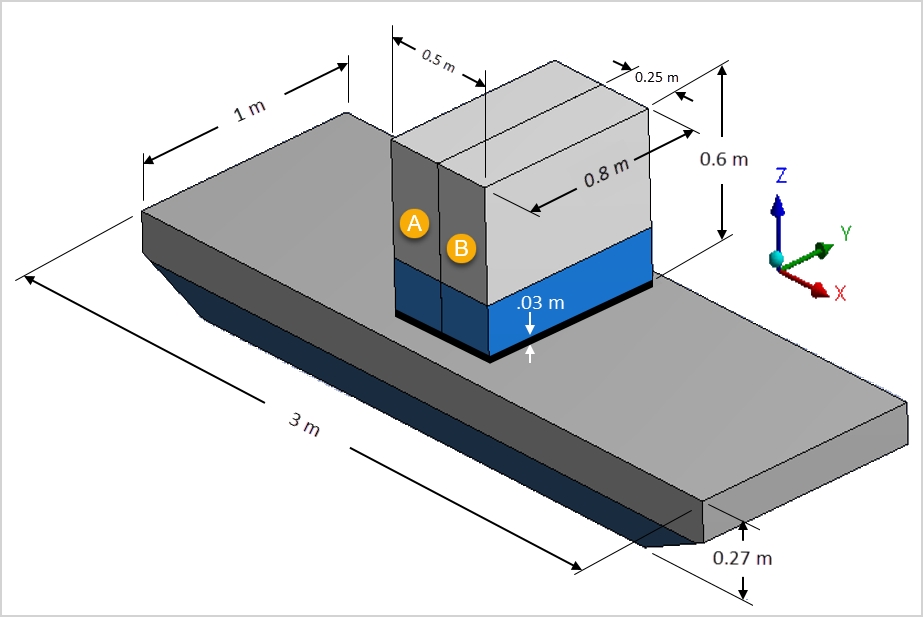
A barge model, shown in the problem sketch below, has the following characteristics: The barge is 3 m long, 1 m wide, and has a depth of 26.7 cm. There are two water tanks (A and B) installed on the deck. Their internal bottom is located 30 cm above the keel line.
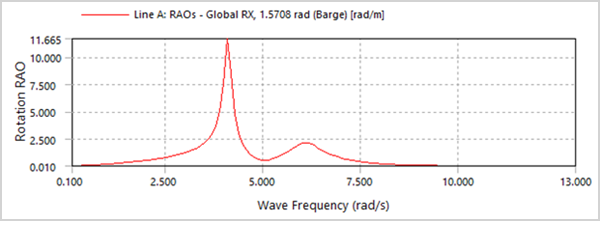
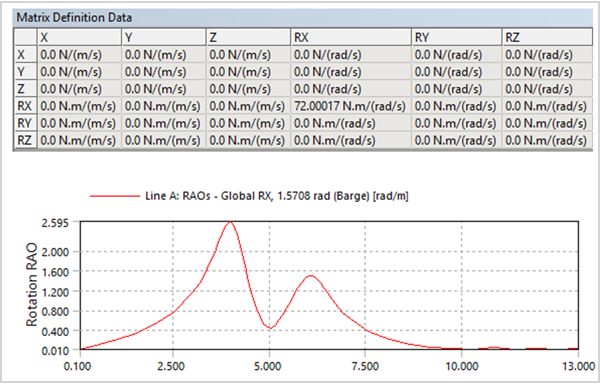
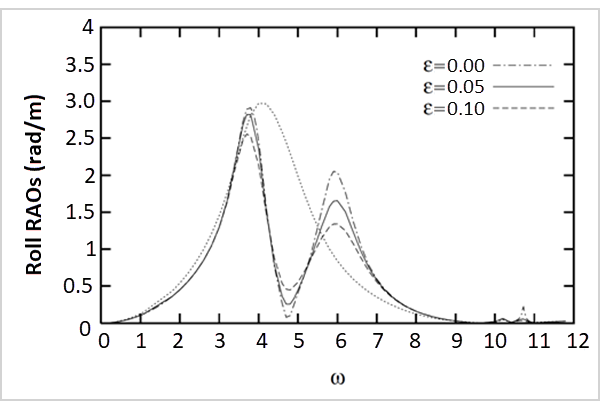
Test the model to predict the combined dynamics of a floating support and the sloshing motions in the tanks. Compare the rotational RAO in the global X component to those values in the references (Malenica et. al., 2003 and Molin et. al., 2002), direction 90 degrees.
Analysis Assumptions and Modeling Notes
Frequency Interval Used
The RAO and added mass curves are quite sensitive to the number of frequencies calculated. For that reason, the frequencies used to draw the added mass and the RAO are set according to the gradient of the curve– that is, the greater the gradient, the smaller the interval.
Frequency Intervals Used in the Validation Work:
| RAO | |
| Frequency Range | Number of Intermediate Values |
| 0.1 - 3 | 15 |
| 3 - 8 | 65 |
| 8 - 12 | 15 |
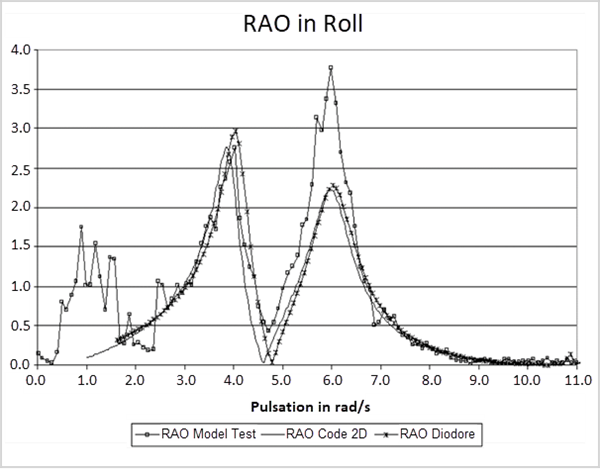
The data in Molin's paper are based on tests using a physical model (Molin et. al., 2002). Therefore, it provides a real-world benchmark for evaluating the results generated by Ansys Aqwa.
Malenica's paper employs an analytical/numerical method to resolve the dynamic coupling of seakeeping and sloshing. He uses graphs of added mass and RAO results under different damping parameters of sloshing (Malenica et. al., 2003). This will serve as a reference for analyzing the effect of the damping factor in the simulation.
Modeling Notes
Both references use a similar model, a barge with tanks on it. While the dimensions of both models are the same, there are some differences. Malenica uses a rectangular barge while Molin's is a trapezoid below the water. For this test case, Molin's trapezoid model is used because it provides more detailed data on mass positions and values.
Results Comparison
Ansys Aqwa Results
Reference Results
Natural Modes Comparison
In the model test configuration, the barge was anchored to the walls of the wave tank with four aerial mooring lines and resulted in a natural period in sway of 20 second (Molin et. al., 2002).The mooring lines are defined in the hydrodynamic response stability analysis system. Here, the natural modes are compared against the references. In Aqwa, a period of 20 produced the largest amplitude in Y.
| Result | Target | Workbench App | Error (%) |
| Period | 20 | 20.036 | 0.0869% |