In free view, you can display a plot of the values of a dependent variable versus those of an independent variable.

Initially, the application plots the first column of independent variables on the x-axis and the first column of dependent variables on the y-axis. The plotted variables are labeled on the axes of the plot.
Data in the table can overlap for different parts of the table. The connected lines in the graph follow the data in the order of the table, which may cause the lines to overlap and cross.
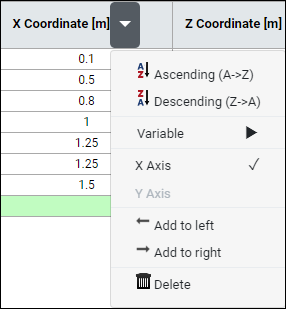
To change which variables are plotted on the x or y-axis:
Click the drop-down menu arrow next to the variable you want to plot.

Select whether you want to plot the variable on the or the . A check mark appears next to the selected axis.


