


The Time Domain Pressures results object enables the display of the instantaneous internal tank and external hull surface pressures generated by Aqwa, during a time domain response analysis in which the Hydrodynamic Response Analysis Settings option Analysis Type is set to Irregular Wave Response or Regular Wave Response. Any number of Time Domain Pressures results may be added.
The Time Domain Pressures result shows the pressures at the element centroids, and can be directly compared with results in Mechanical once a load transfer procedure has been completed (see The Hydrodynamic Pressure Mapping Add-On for more information).
When there is more than one structure in the model and Output for Structure is set to All Structures in the Analysis Settings, the Structure dropdown list allows you to select the structure(s) that should be shown in the Time Domain Pressures result. The Structure field will be read-only if there is only one structure for which time domain pressures are being calculated.
The Display Pressures At option can be defined as:
Single Time Step - select a single Output Time at which pressures will be displayed.
Multiple Time Steps (Animation) – select an Output Start Time and Output Finish Time to define the start and finish times for an animation of time domain structure motions and panel pressures. The Number of Steps field is automatically updated to indicate the number of frames that will be displayed in the animation.
Note: The Output Time, Output Start Time, and Output Finish Time fields are automatically adjusted to be within the range of the Hydrodynamic Response Analysis Settings Output Start Time and Output Finish Time, and are rounded to the nearest whole number of Output Step intervals.
When the Display Pressure At option is set to Multiple Time Steps (Animation), and once you have evaluated the Time Domain Pressures results (right-click on the object and select Evaluate All Results), controls appear that allow you to start, pause, and stop the animation. You can click on the wave elevation timeline to display results at a particular instant. Other controls allow you to change the speed of the animation, and to create a .AVI animation file from the current frames.
Under the Contour Selection section of the Details panel, the read-only Contour Type field indicates that Structure Panel Pressure will be displayed. You can use the Pressure Measurement option to change the reported results between Head of Water and Force/Area. You may choose to set Mesh Element Outlines Off from the graphical toolbar to provide a clearer image.
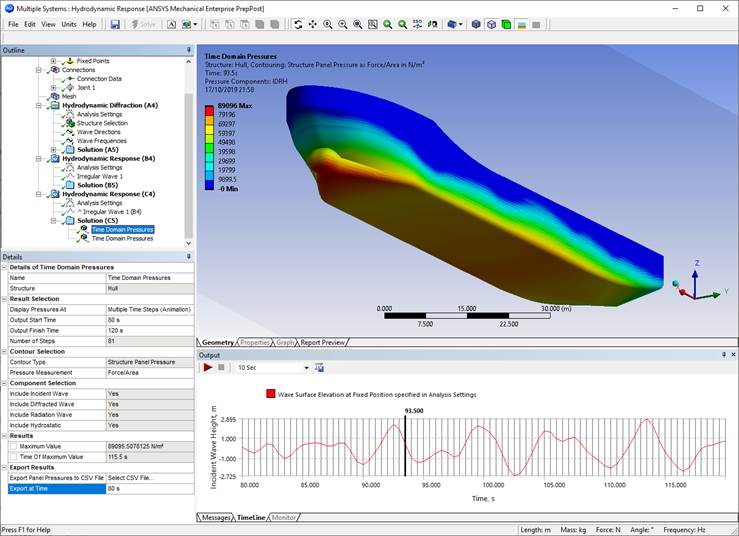
The combination of wave components included in the reported results is indicated in the Component Selection section of the Details panel. Incident, Diffracted, Radiation, and Hydrostatic components are always included in the Time Domain Pressures result.
The Maximum Value of the results are shown, and where Display Pressures At is set to Multiple Time Steps (Animation), the Time of Maximum Value is also provided. Both of these fields can be parameterized.
Once the Time Domain Pressures result has been evaluated, you can export pressure data into a comma-separated values (.CSV) file using the Export Panel Pressures to CSV File option. From the range of times defined in the Result Selection details, set Export at Time to define the time at which panel pressures will be output; Export to Time will be read-only if Display Pressures At is set to Single Time Step. The Export to Time field is automatically adjusted to the nearest whole number of Output Step intervals. The .CSV file contains a row for each panel element on the selected structure(s), and has the following columns:
Part name
Surface Body name
Element number
Instantaneous position (X, Y, Z) of the element centroid
Instantaneous unit normal vector (X, Y, Z) for the element orientation
Element area
Instantaneous total pressure (sum incident, diffracted, radiation and hydrostatic components)