


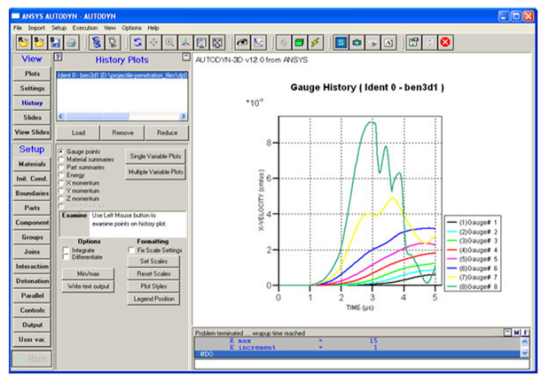
This panel lets you compose and display time histories of Gauge points and Summary variables.
When you select this panel, the history and summary data associated with the model you are working with will be automatically loaded and the model's Ident will be displayed in the window at the top of the panel.
- Load
Load history data for other models.
- Remove
Remove history data for the selected model (at least one model must remain loaded at all times).
- Reduce
Reduce the amount of history data stored for a model.
- History Type
Select the type of history you want to view from the following options:
- Gauge Points
Variable histories at gauge points.
- Material Summaries
Mass, energy and momentum sums for each material.
- Part Summaries
Mass, energy, and momentum sums for each Part.
- Energy
Energy balance.
- X momentum
X momentum balance.
- Y momentum
Y momentum balance
- Z momentum
Z momentum balance
- Jetting Analysis
Jetting analysis plots (active only if model uses Jetting).
- Single Variable Plots
Compose plots of a single variable
- Multiple Variable Plots
Compose plots including multiple variables
- Examine
Use the left mouse button to select a point on the graph. The corresponding curve label and x and y values are displayed in the Examine panel.
- Integrate
View integrals of the variables in the current plot.
- Differentiate
View differentials of the variables in the current plot.
- Min/Max
View maximum and minimum values for the current plot.
- Write textfile (uhs)
Output the data from the current plot (Write UHS for current history plot) or output all the gauge data from a history file (Write Output for all gauges and variables in selected ident).
- Set scales
Autodyn automatically chooses scales for your plots based on minimum and maximum values of the data. Clicking this button lets you set your own scales.
- Plot Styles
Set the color, style and thickness of lines for each plot.
- Legend Position
Position the legend anywhere in the view.