Ensure that the losses generated by Maxwell are the same as those consumed by the Fluent. To verify the application of losses, check System Coupling's Transcript and EnSight-formatted Results files, as described in the following sections:
Review the Sum value recorded for the final coupling iteration to verify that the losses sent by Maxwell match those received by Fluent.
Figure 16: Losses reported in the Transcript at 20 [s]
+=============================================================================+
| COUPLING STEP = 20                        SIMULATION TIME = 2.00000E+01 [s] |
+=============================================================================+

...

+-----------------------------------------------------------------------------+
|                           COUPLING ITERATION = 3                            |
+-----------------------------------------------------------------------------+

...
+-----------------------------------------------------------------------------+
| Fluid Flow (Fluent)                 |                                       |
|   Interface: CouplingInterface 1    |                                       |
|     Heat Rate                       |             Converged                 |
|       RMS Change                    |     8.73E-06          1.19E-05        |
|       Sum                           |     6.22E-01          6.22E-01        |
+-----------------------------------------------------------------------------+
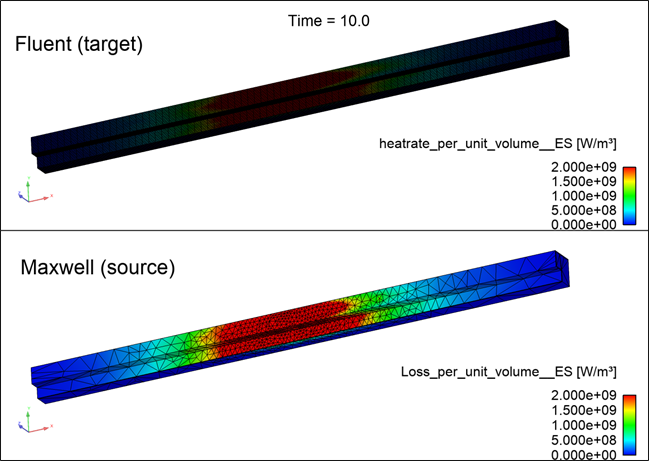
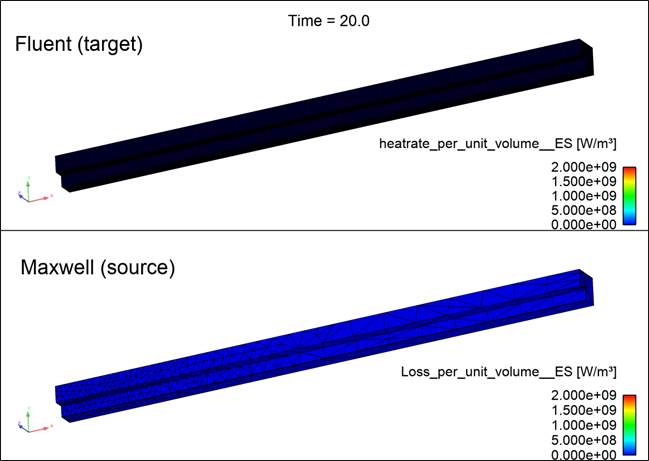
Because Heat Rate is an extensive quantity, you will visualize the application of Maxwell-generated losses per-unit-volume to Fluent's thermal analysis. Use the following variables:
Fluent (elements): heatrate_per_unit_volume__ES
Maxwell (elements): Loss_per_unit_volume__ES
For consistency, adjust the palette ranges as shown in the images below.