To evaluate mapping quality, check System Coupling's Transcript and EnSight-formatted Results files, as described in the following sections:
In System Coupling's Transcript, a Mapping Summary was generated for each coupling step. For the final coupling step, it shows the following diagnostics:
- Heat Rate
For the Heat Rate data transfer, 100% of Fluent's target elements intersect with obtain values from 100% of Maxwell's source elements.
No further investigation of Heat Rate mapping is necessary.
- Temperature:
For the Temperature data transfer, 100% of Maxwell's target elements map into Fluent's source elements and receive their values from those elements.
However, the Maxwell target receive their values from only 53% of Fluent's source elements. This is common if the source mesh is finer than the target mesh. Based on these diagnostics, you should open the co-simulation results in EnSight and examine the Temperature mapping more closely.
Figure 9: System Coupling's mapping diagnostics for Coupling Step 20
+=============================================================================+
| COUPLING STEP = 20                        SIMULATION TIME = 2.00000E+01 [s] |
+=============================================================================+

+-----------------------------------------------------------------------------+
|                               MAPPING SUMMARY                               |
+-----------------------------------------------------------------------------+
|                                     |      Source            Target         |
+-----------------------------------------------------------------------------+
| CouplingInterface 1                 |                                       |
|   Temperature                       |                                       |
|     Mapped Elements [%]             |        46               100           |
|     Mapped Nodes [%]                |        65               100           |
|     Mapped Volume [%]               |        41               100           |
|   Heat Rate                         |                                       |
|     Mapped Elements [%]             |       100               100           |
|     Mapped Nodes [%]                |       100               100           |
|     Mapped Volume [%]               |       100               100           |
+-----------------------------------------------------------------------------+
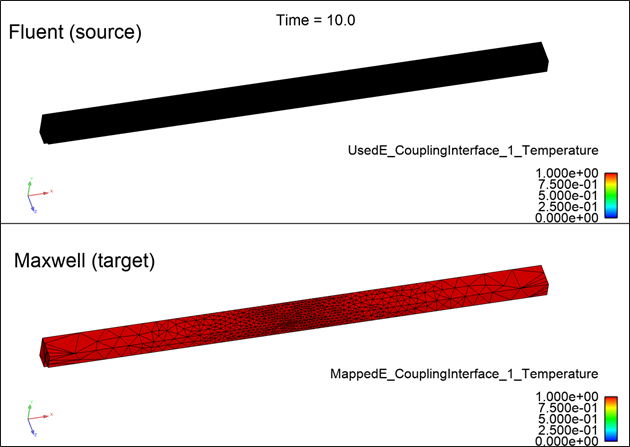
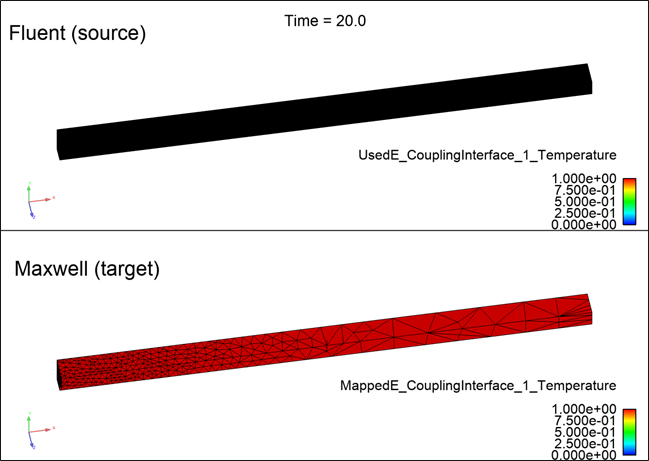
In EnSight, visualize Temperature mapping on the source and target sides of the interface.
Drag the element-based mapping variable UsedE_Coupling_Interface_1_Temperature from the Variables pane and drop it onto all the Fluent participant regions in the Parts pane.
Drag the element-based mapping variable MappedE_Coupling_Interface_1_Temperature from the Variables pane and drop it onto all the Maxwell participant regions in the Parts pane.
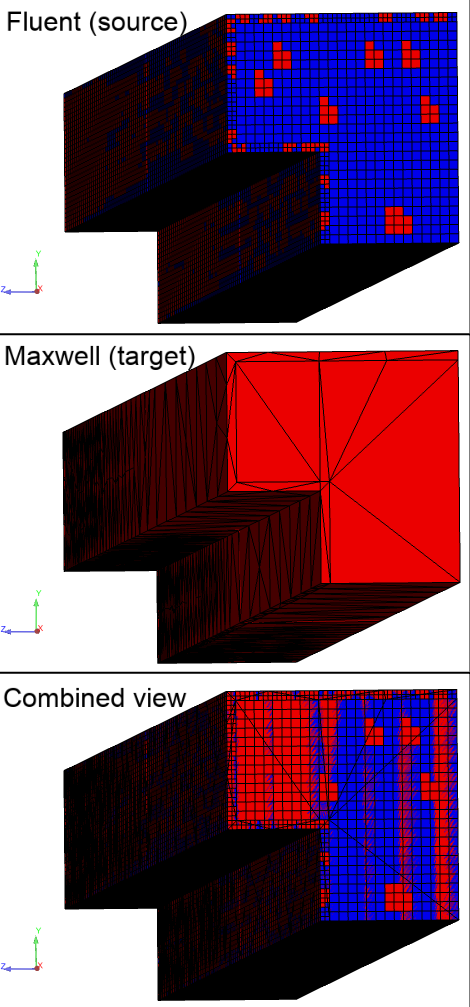
The image below confirms the information provided in the Transcript.
Each target element centroid is receiving Temperature data, either interpolated from mapping weights (for mapped locations) or filled in with the value from the nearest source element (for unmapped locations).
However, you can see that not all source temperatures are used on the target.
Zoom in for a closer view of the source elements in relation to the target elements, as shown in the image below. A majority of the source elements are unmapped, yet all of the target elements receive values from the source. Maxwell has data on element centroids, which for volume elements, are located inside the mesh. The centroids take their values from the nearest source elements inside the geometry, leaving the data on surface elements unused.
Also, note that source mesh is significantly finer than the target mesh. For transfers of intensive quantities, it is generally better to have a target-mesh resolution that is similar to or finer than the source mesh. This helps to ensure that features that are finely resolved on the source mesh are not lost in the transfer to the coarser mesh.