


Time-temperature equivalence (or superposition) can
be applied, for example, in the measurements of linear properties  and
and  . Usually, devices allow a measurement within a given interval of
angular frequencies. However, when performing measurements at different
temperatures, it is possible to expand the interval of angular frequencies. If the
relationship between linear properties and temperature is unknown, it is reasonable
to assume that the dependence is the same for
. Usually, devices allow a measurement within a given interval of
angular frequencies. However, when performing measurements at different
temperatures, it is possible to expand the interval of angular frequencies. If the
relationship between linear properties and temperature is unknown, it is reasonable
to assume that the dependence is the same for  and
and  . Hence the ratio
  , when plotted against the angular frequency, will typically have
the same shape for different temperatures, though the curves will shift along the
horizontal axis. That is, an experiment performed at a lower temperature corresponds
to an experiment at a higher temperature within a higher interval of angular
frequencies. You can then combine the data by shifting the curves and thereby expand
the interval of angular frequencies, possibly beyond the technological limits of the
measurement device. Simultaneously, the identification of the corresponding shift
factor will characterize the dependence with respect to temperature for subsequent
analysis; this is relevant, for example, for the complex viscosity. It is therefore
possible to acquire information on the temperature dependence of the properties, as
well as to expand the knowledge of linear properties.
, when plotted against the angular frequency, will typically have
the same shape for different temperatures, though the curves will shift along the
horizontal axis. That is, an experiment performed at a lower temperature corresponds
to an experiment at a higher temperature within a higher interval of angular
frequencies. You can then combine the data by shifting the curves and thereby expand
the interval of angular frequencies, possibly beyond the technological limits of the
measurement device. Simultaneously, the identification of the corresponding shift
factor will characterize the dependence with respect to temperature for subsequent
analysis; this is relevant, for example, for the complex viscosity. It is therefore
possible to acquire information on the temperature dependence of the properties, as
well as to expand the knowledge of linear properties.
To illustrate how time-temperature equivalence can
be used, consider the following figure, which shows the measurement of linear
properties  (thick lines) and
  (thin lines) for angular frequencies ranging from
10–2 to 102. The
data is measured at four temperatures, represented here in black, blue, magenta, and
red.
(thin lines) for angular frequencies ranging from
10–2 to 102. The
data is measured at four temperatures, represented here in black, blue, magenta, and
red.
![G' and G" vs. Angular Frequency [rad/s]](graphics/g_pm_sec_guidelines_FigA__g1_g2.png)
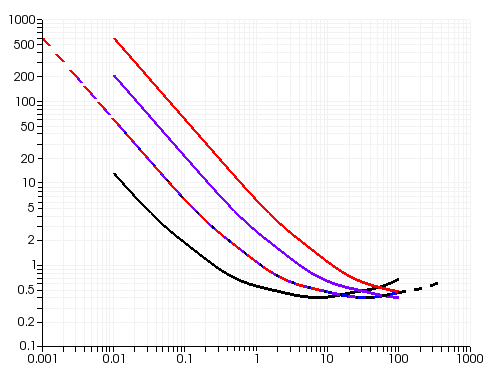
The next figure shows the properties  , for each temperature ranging from black to red. The blue
temperature is the reference temperature that will be used to build the master
curves.
, for each temperature ranging from black to red. The blue
temperature is the reference temperature that will be used to build the master
curves.
![G"/G' vs. Angular Frequency [rad/s]](graphics/g_pm_sec_guidelines_FigB__tan_d.png)
The curves from the previous figure can be combined into a single curve, as shown in the following figure. The black curve is shifted to the right, while the magenta and red curves are shifted to the left; the shift factors are kept for further evaluation of the temperature dependence of the properties. Combining these four curves into the dashed line enables you to expand the interval of angular frequencies.
The shift factors obtained in the previous step can be applied to the linear
properties  and
and  , in order to obtain the master curves in the figure that
follows.
, in order to obtain the master curves in the figure that
follows.
![Master Curves for G' and G" vs. Angular Frequency [rad/s]](graphics/g_pm_sec_guidelines_FigD__g1_g2_shift.png)
The applicability of the time-temperature equivalence depends on the material considered, and is affected by the actual temperature dependence of the properties. Experience and specialized literature can provide further information.