With a field-MOP, oSP3D provides a technology for approximating field data by nonlinear approximation functions. The quality of the field-MOP can be accessed easily through the F-CoP, which visualizes in 3D the approximation quality for each respective position on the mesh.
The F-CoP can be represented by:
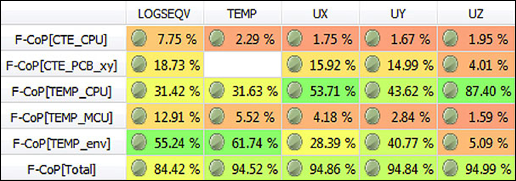
A single F-CoP value, which is a spatially averaged value of the CoP for the entire field. This image is an F-CoP matrix showing spatially averaged prognosis quality and sensitivity indices:
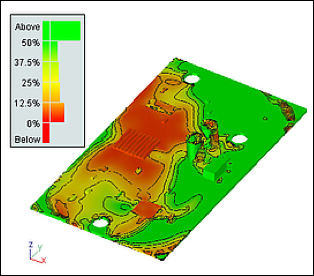
An F-CoP plot, which is the CoP at the respective position. This image is an F-CoP plot in 3D that highlights the sensitivity of the temperature field with respect to input parameter variations:
The CoP represents as a percentage the amount of the expected variance that can be explained by the model.
The F-CoP of the whole model (F-CoP(Total) is the explainable variation at a specific position (prognosis quality).
The F-CoP for an individual input parameter is the explainable variation at a specific position through the respective parameter.
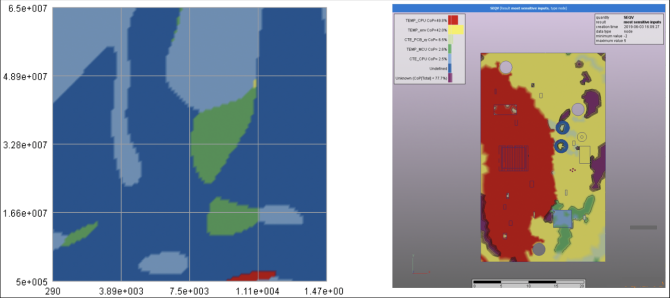
The field-MOP creates a data-based ROM but also reduces the set of input parameters to the relevant sub-set and orders the remaining inputs according to their importance. The importance (sensitivity) can be measured in terms of an average value or by a spatially variable plot.
To simplify the analysis, you can visualize the most important input for each position. This image shows the most important input plot in 3D, highlighting the input that is most important for a specific region on a FEM mesh (left) and on a performance map (right):