


You can calculate designs by using the Metamodel of Optimal Prognosis (MOP) solver wizard.
To use the MOP solver:
On the Excel Ribbon, switch to the tab.
Click .
The MOP solver dialog opens.
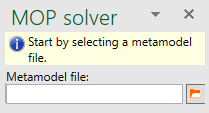
To the right of the Metamodel file field, click the orange folder.
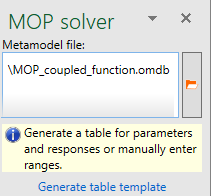
Browse to and select the OMDB file that contains a metamodel.
To see an example, select the MOP_coupled_function.omdb file from the excel_tools folder here .
Click .
Select a cell for table generation. For example, A1.
Click .
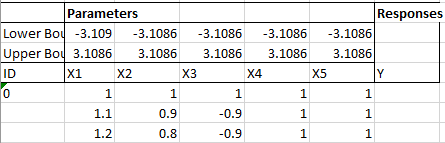
The design table is generated and displayed.
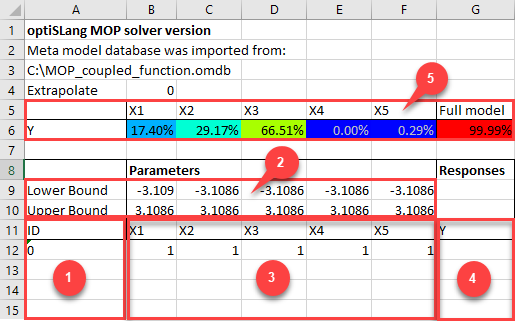
Number Description 1 Optional design ID 2 Lower and upper parameter bounds 3 Parameter names and values 4 Response names and values 5 CoP matrix In the design table, add parameter values and optionally a design ID.
Select at least one parameter per design for calculation.
To allow input parameters to exceed the MOP sampling bounds select the check box.
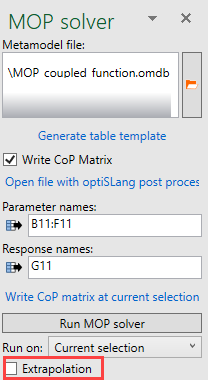
When the check box is clear, input values are checked before approximation and the application stops with an error if the input values cannot be processed. Only select the check box to include input values in the forecast model that are outside but close to the sample bounds.
Click .
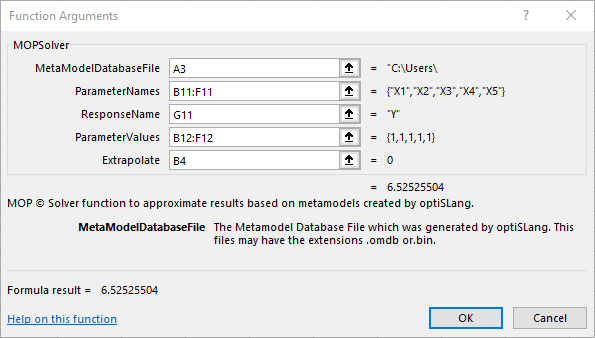
MOPSolver Function
The table template contains the MOPSolver field function for all responses and criteria of the reference design. You can use it like all other Excel functions.
You can easily select the reference design and drag the selection which automatically adopts the result cells to the new input range.
An input value change is evaluated immediatelly if your formula calculation options are set to .
The Extrapolation argument evaluates to true if it is set to 1, otherwise to false.