


VM-LSDYNA-SOLVE-021
VM-LSDYNA-SOLVE-021
Plastic Compression of a Pipe Assembly
Overview
| Reference: | Crandall, S.H. & Dahl, N.C. (1959). An Introduction to the Mechanics of Solids. McGraw-Hill Book Co, 180. |
| Analysis Type(s): | Plastic Structural Analysis |
| Element Type(s): | Beam |
| Input Files: | Link to Input Files Download Page |
Test Case
This test case also appears in the Workbench Mechanical Verification Manual. See VM-WB-MECH-047.
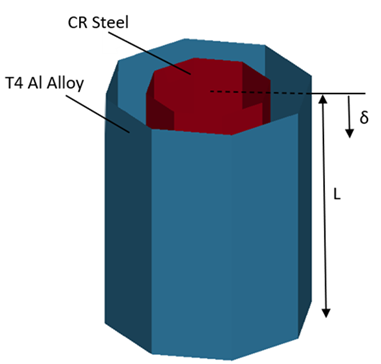
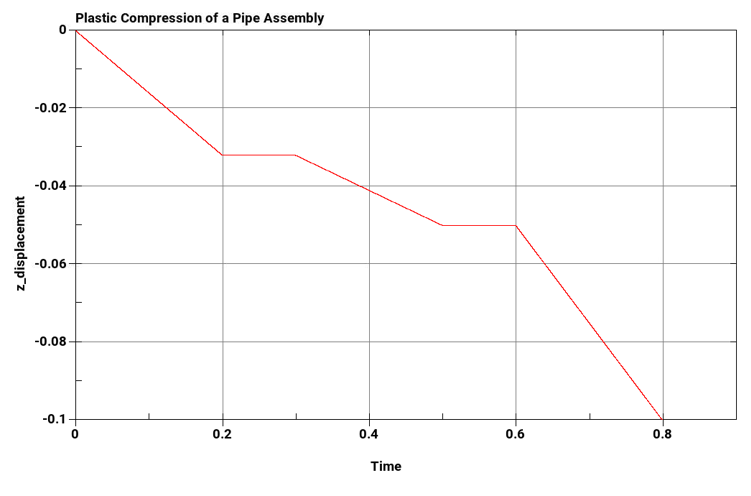
Two coaxial tubes, the inner one of 1020 CR steel, and the outer one of 2024-T4 aluminum, are compressed between heavy, flat end plates. Determine the load-deflection curve of the assembly as it is compressed into the plastic region by an axial displacement. Assume that the end plates are so stiff that both tubes are shortened by exactly the same amount. The applied displacement with respect to time is given in the plot below. Material, displacement, and geometric properties of the assembly are given in the table below.
Note regarding the problem sketch: Beam Prism View in LS-PrePost does not accurately show tube cross section and wall thickness.
| Geometric Properties | Material Properties | Loading |
|---|---|---|
| CR Steel |
1st Load step: δ = -0.032 in 2nd Load step: δ = -0.05 in 3rd Load step: δ = -0.1 in | |
| Es = 26,875,000 psi | Inside radius = 1.9781692 in | |
| σyield,s = 86,000 psi | Wall thickness = 0.5 in | |
| ν = 0.3 | L = 10in | |
| T4 Al Alloy | ||
| Ea = 11,000,000 psi | Inside radius = 3.5697185 in | |
| σyield,a = 55,000 psi | Wall thickness = 0.5 in | |
| ν = 0.3 | L = 10 in | |
Analysis Assumptions and Modeling Notes
The assembly is modeled with beam elements using ELFORM 1 with 2x2 Gauss quadrature. CST is set to 1 in *SECTION_BEAM to set cross section type to tubular. Two parts, one for steel and one for aluminum, were created with coincident nodes. The top and bottom-most nodes were merged so that parts shared equal boundary conditions. The bottom node was constrained in all translational degrees of freedom using *BOUNDARY_SPC_NODE. The top node was prescribed displacement using LCID in *BOUNDARY_PRESCRIBED_MOTION_NODE with VAD set to 2.
The steel and aluminum material properties were defined using *MAT_PLASTIC_KINEMATIC. *DAMPING_GLOBAL was added with VALDMP set to 200 to define mass weighted nodal damping. *DATABASE_NODOUT and *DATABASE_BNDOUT were used to measure displacement and load, respectively.
Results Comparison
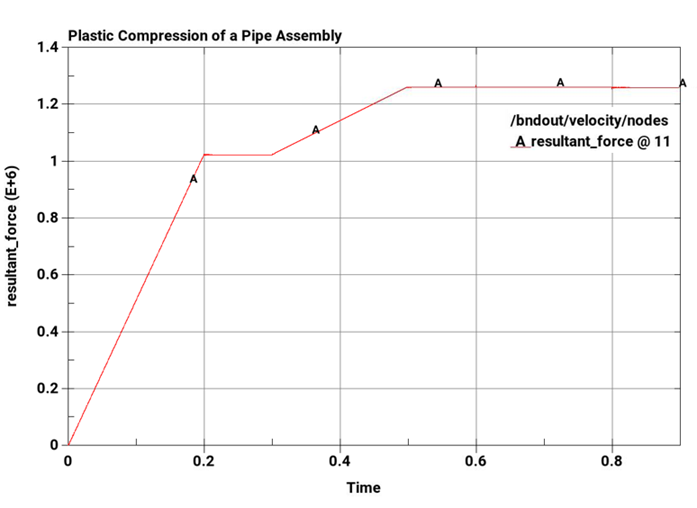
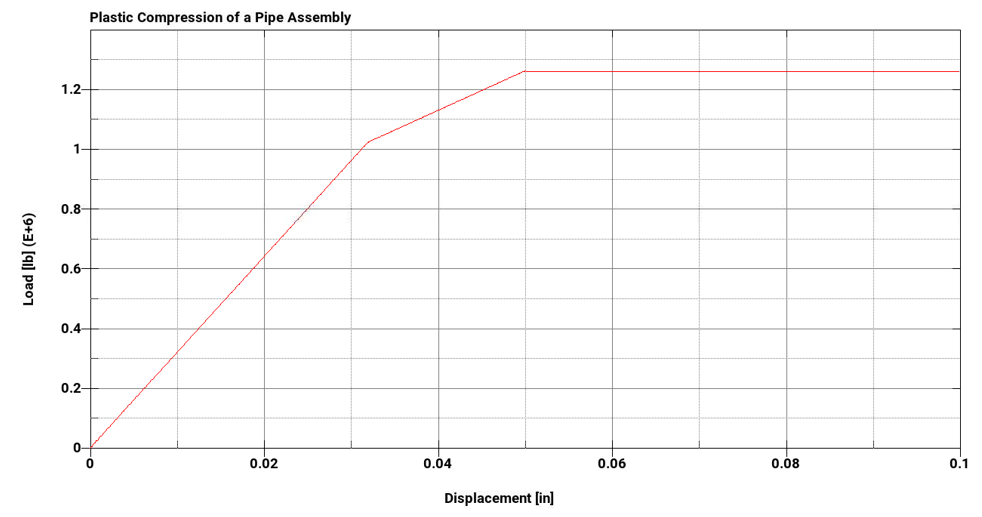
The following plots show the load step with respect to time and the load-deflection curve, respectively. A wait time of 0.1 seconds was allotted between load steps.
| Results | Target | LS-DYNA | Error (%) |
|---|---|---|---|
| Load, lb for Deflection @ 0.032in | 1.0244E6 | 1.0237E6 | 0.068 |
| Load, lb for Deflection @ 0.05in | 1.262E6 | 1.2614E6 | 0.060 |
| Load, lb for Deflection @ 0.1in | 1.262E6 | 1.2608E6 | 0.095 |