


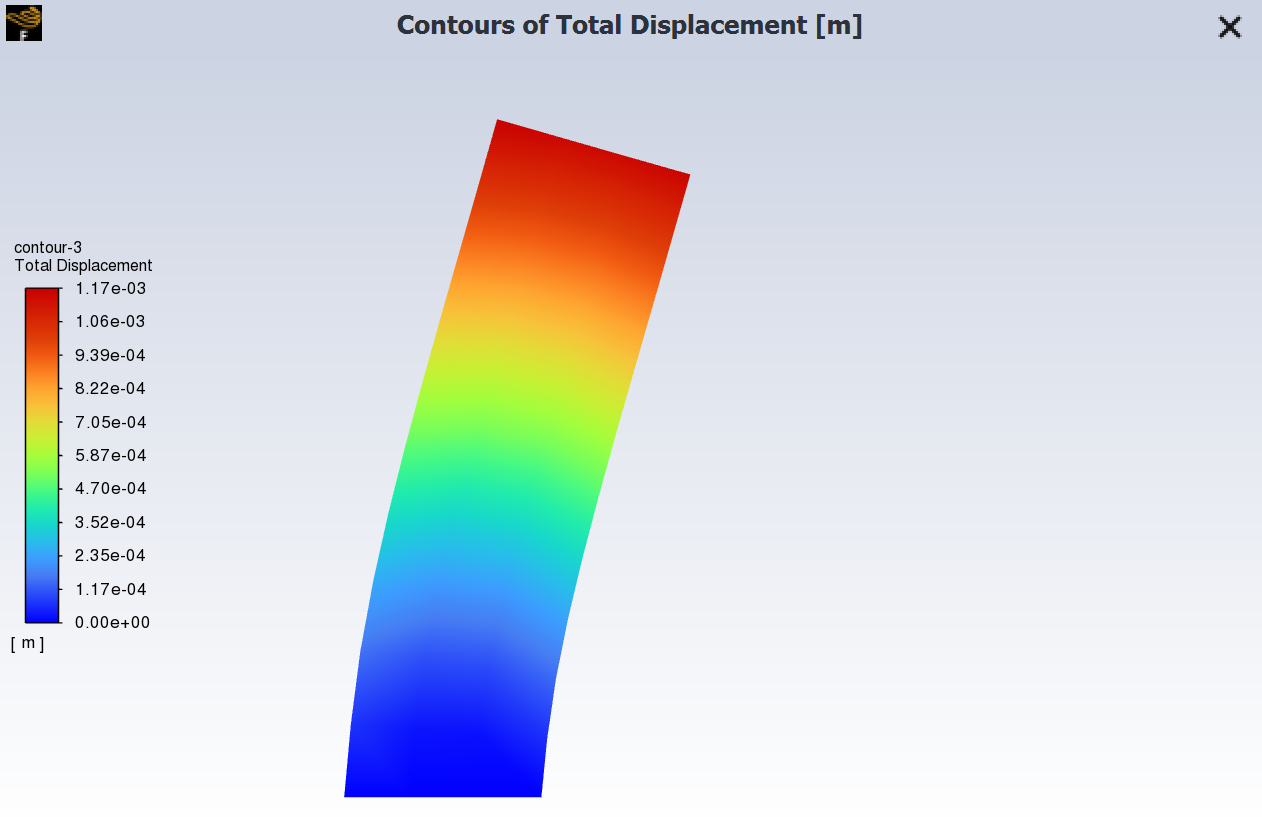
With beta features enabled (as described in Introduction), you can visualize structural variable results on the deformed solid zone.
To visualize the deformation:
Ensure the Structural model is enabled and that you have either run the solver or loaded a data file.
Define the contours display by first opening the Contours dialog box.
 Results → Graphics
→ Contours → New...
Results → Graphics
→ Contours → New...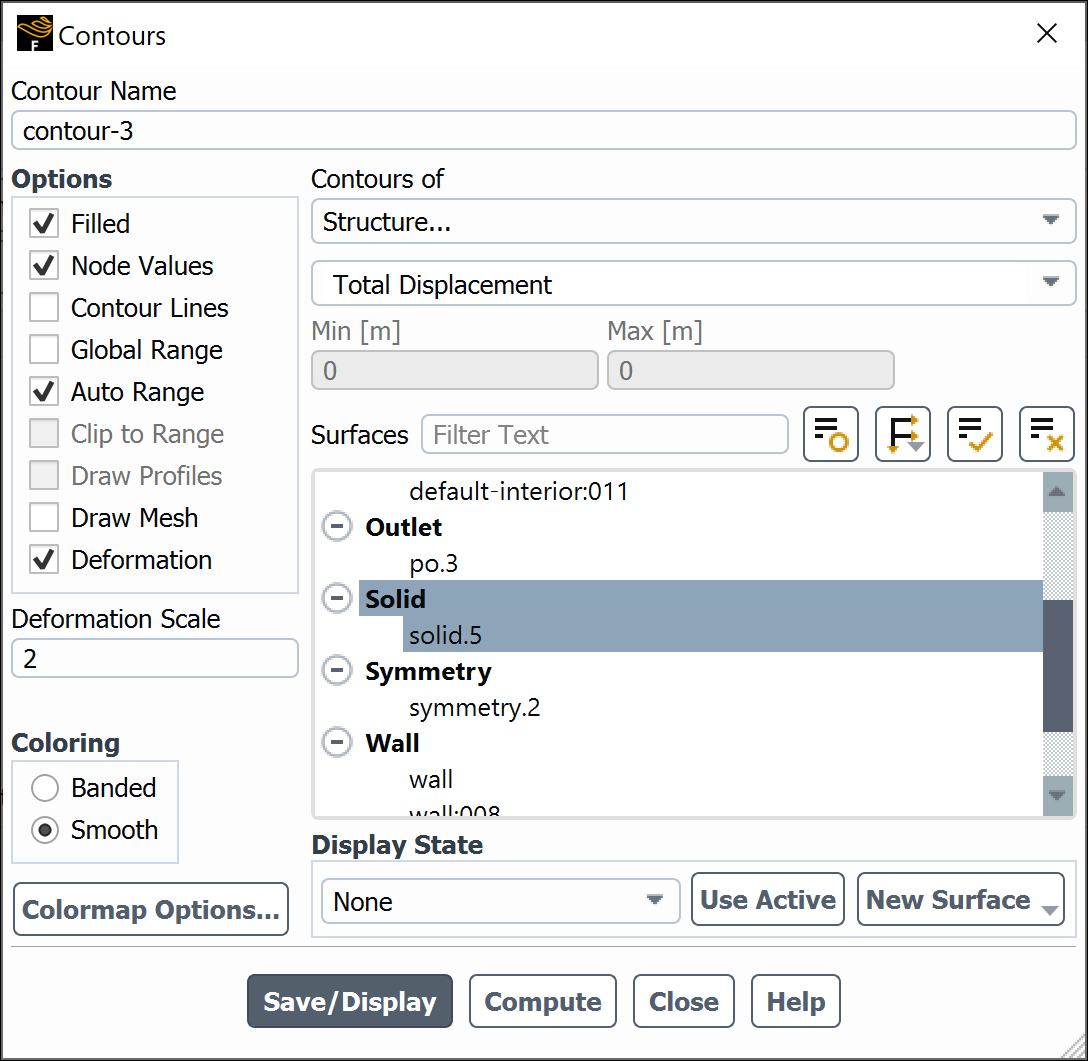
Enable Deformation in the Options group box and specify how you want the deformation scaled in the Deformation Scale field.
Specify how you want the deformation colored by selecting Structure... in the first Contours of drop-down list and the desired structural quantity in the second drop-down list.
Select the solid surface in the Surfaces list and click .
Limitations
There are some limitations associated with the Deformation option in the Contours dialog box:
Deformation can only be shown on structures, either solid or porous structure zones—the fluid regions cannot move to reflect the solid deformation. If fluid surfaces are selected, the deformation will not be shown.
Only variables that are computed on structures (for example, those under Structural..., energy, and so on) can color the deformed surface. If other variables are selected, the deformation will not be shown.