


After enabling beta feature access, as described in Introduction, you are able to access visualization tools specific for your optiSLang-generated design point study. Under optiSLang Capabilities in the Parametric ribbon, the Data Visualization tool opens a window where you can see various plots and data related to your design points and parametric run.
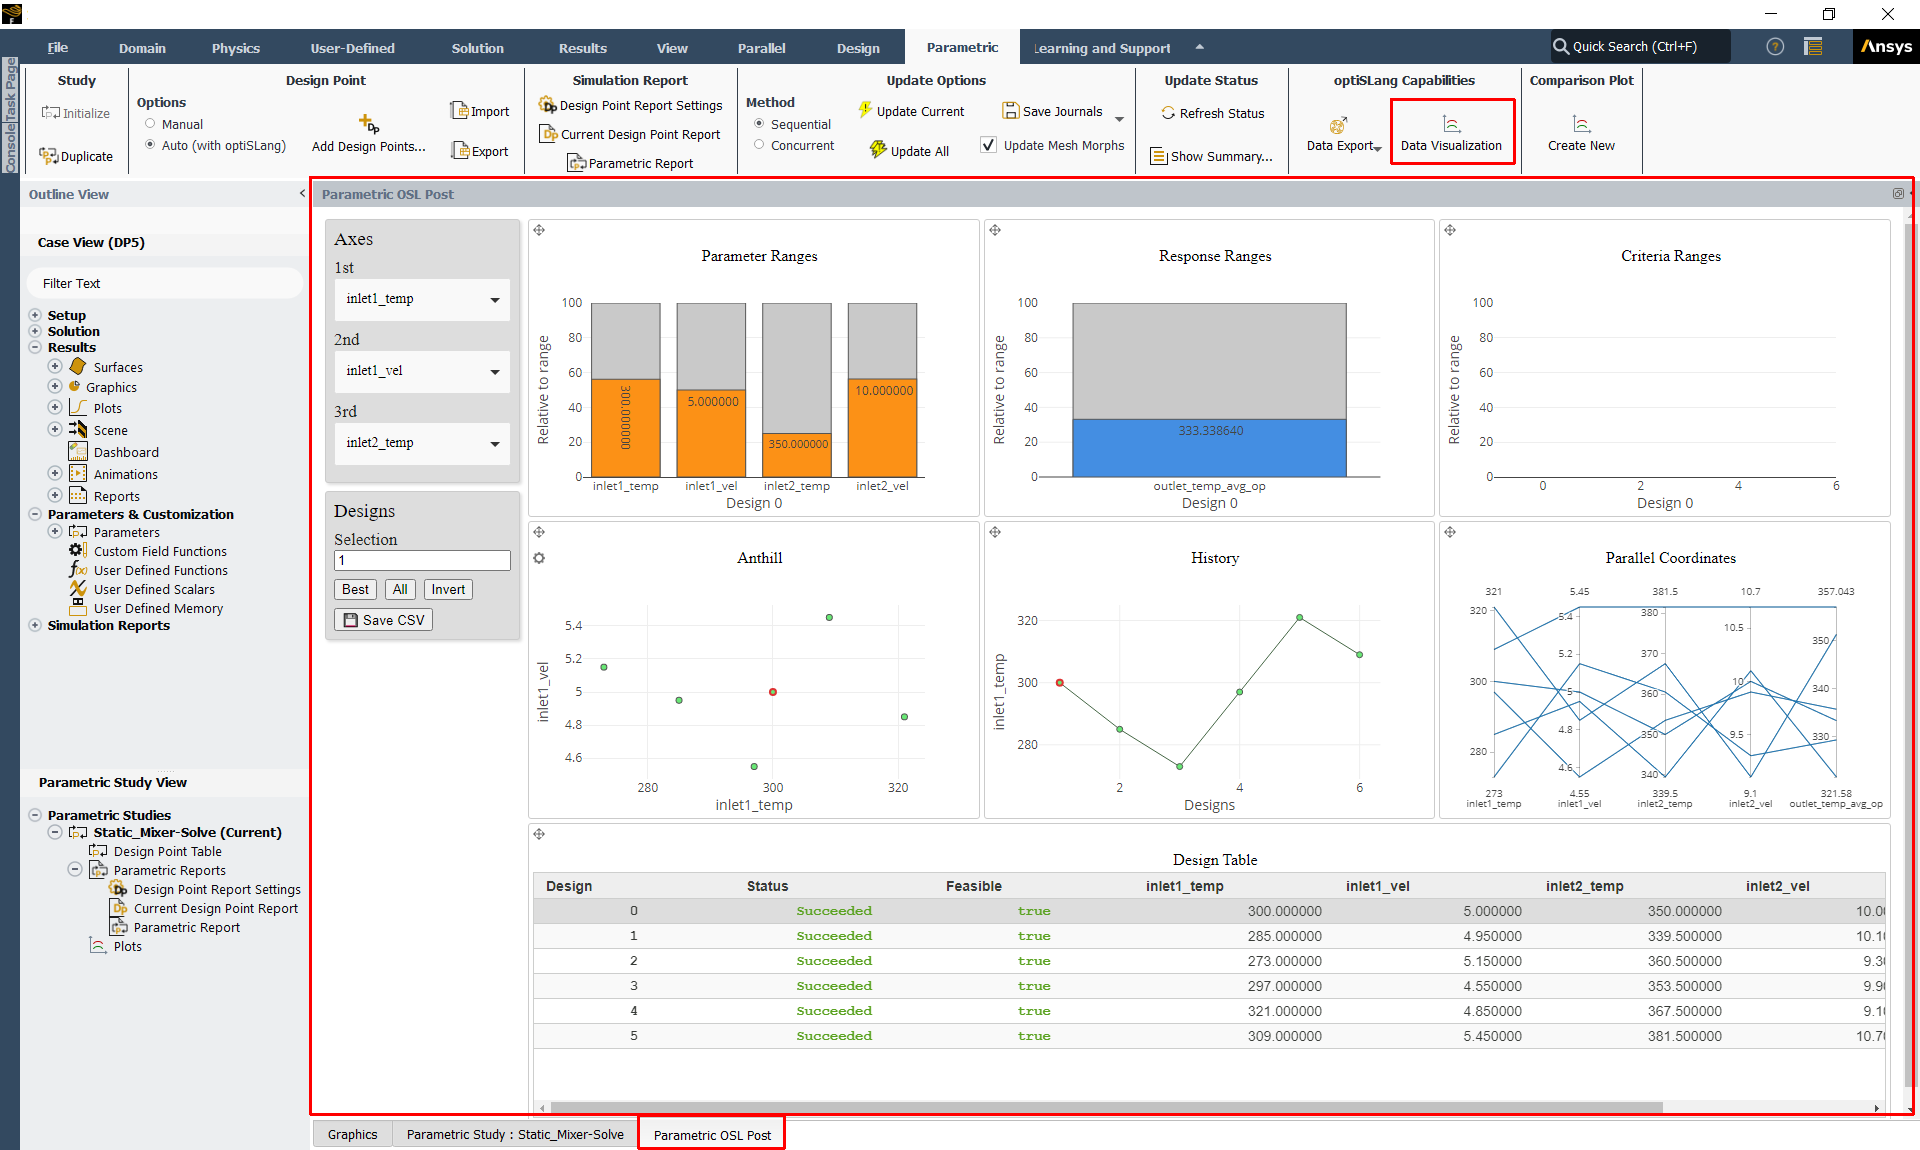
Interactive plots are provided to give you detailed insight for each design point in
your parametric study. Click areas of one plot to see how the other plots change.
Individual plots can be expanded to more easily view details. Plots can be saved as
.png format.
An interactive Design Table is also provided to give you an overview of the status and values of the input and output parameters of your design points. Click in the table to see how the plots change.
Under Axes, you can assign different variables to the first and second axes for corresponding plots. Under Designs, you can also adjust the number of design point values displayed in each plot, as well as save your plotting data to a comma separated value (CSV) file.