The following topics are included in this section:
- Shortcut for Plotting Transient Data over Time
- Shortcut for Plotting Transient Data over Distance
- Long Methodology
- Sample Query Creation and Plot (At Maximum over Time)
- Managing Query Entities
- Over Distance Queries
- Over Time Queries
- Scatter Query Example
- By Operating on Existing Queries
- Queries From External Sources
- Plotting
Select variable(s) in the variable list and then right click on vector or scalar variable(s) in the variable list and choose Plot Maximum (or Minimum) vs Time. EnSight will step through all timesteps, calculating the maximum (or minimum) of scalar variable(s) or vector magnitude variable(s) and create a query for each selected variable and put each new query curve into a new plot.
Select per part constant(s) in the variable list and then right click on one of the selected constant variable(s), choose Plot Maximum, Plot Minimum to get a single plot which is the maximum of all parts or selected parts (depending on the sub-menu). Choose Plot vs Time to get the value of each of the selected per part constants in a separate plot with each curve colored the same color as its corresponding part (if the part is not colored by a variable and the parts are different colors). Each query will be named by its corresponding part and var with the legend the part name.
Select one or more Case Constant variable(s) and all three Plot options will produce the same result for each Case Constant variable.
Select 1D part(s) (line parts) in the part list and then right click on one of the selected part(s) and choose Query over Distance; in resulting the variable list pop-up choose variable(s). EnSight will create a query for each chosen variable over distance along each 1D part. It will then make one plot per variable containing the query(ies) for each of the 1D selected part(s) with each curve colored the same color as its corresponding part (if the part is not colored by a variable and the parts are different colors). Each query will be named by its corresponding part and var with the legend the part name.
If multiple cases are loaded, then the queries will be named using the variable, case name, and the part name, and there will be one plot per variable with all of the queries from the part(s) from all the cases showing up on the plot.
One first must create query items, which can be any of the following types:
As one of these is selected, the Feature Panel changes to reflect the information needed (such as variable to use) for the selected type. One can control whether the query entity will be a curve or a scatter plot by the choice for Variable 1 and 2.
Query entities can be printed to the Status History Area, saved to a file, deleted, or plotted.
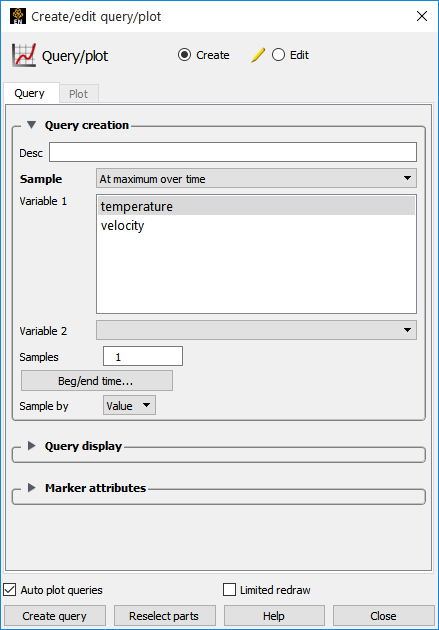
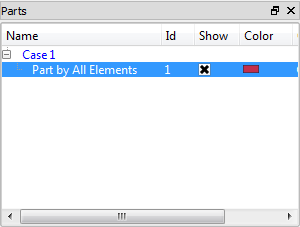
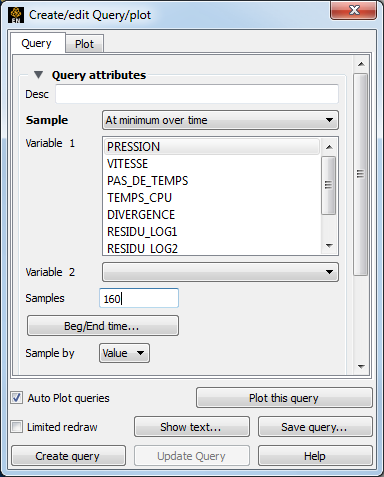
Select the part to query.
Click the Query/Plot icon (or select → ).

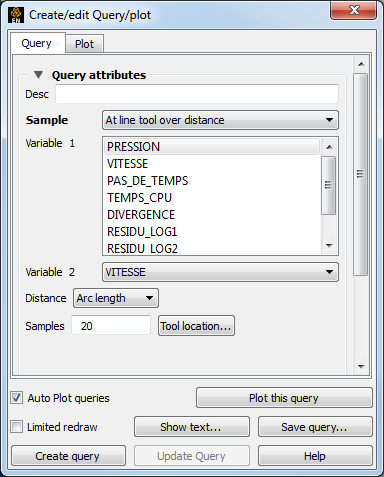
Sample selects the Sample type for the query.
Select the variable(s) for Variable: 1.
Note: For max or min over time you can select multiple variables to query simultaneously over time for efficiency. Leave Variable: 2 as None and it will default to Time, because of sample type.
Click .
The query is created and plotted because the Auto Plot curves toggle is on. Had it been off the query would have been created and you could then plot it.
For more information on plotting, see Plotting.
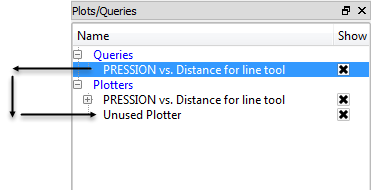
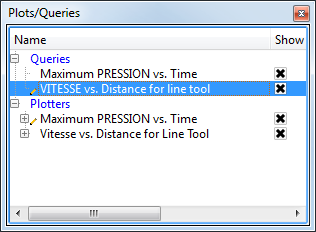
The Feature Panel combined with the Plots/Query lists provides various controls for managing existing Query Entities:
List of Query Entities. The tagged (pencil marker) items are edited in the Feature Panel.
will copy the selected query into a new query.
Any query can be plotted by a right click on the query via the on the pulldown.
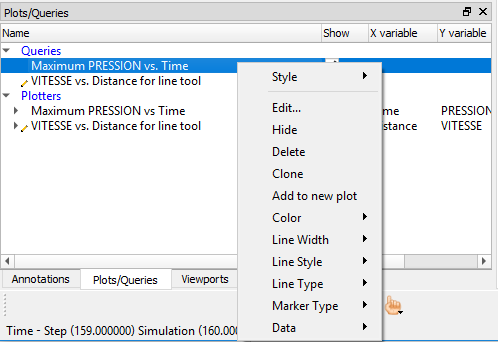
There are several ways to view and use the query data by right clicking on the query in the Query list and choosing from the pulldown.
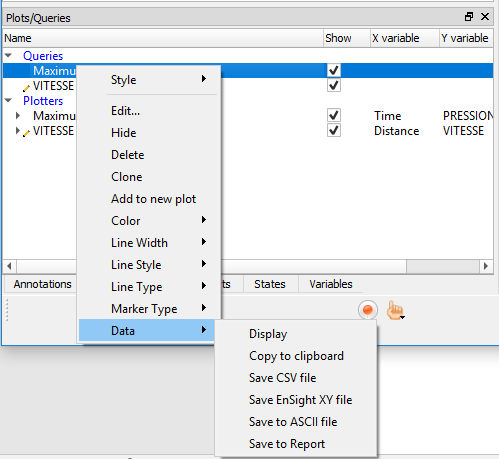
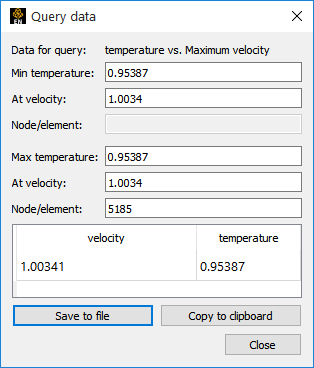
will show a table of values.
will allow the query to be pasted into other applications as columns of data - perfect for Excel for example.
will save a file with comma separated values.
saves a file that can be read back into EnSight as an .
gives you a file that is formatted like a report.
Delete a query by right clicking and choosing from the pulldown.
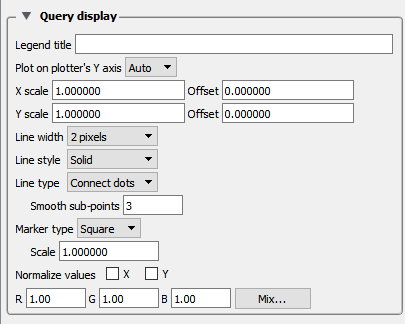
How to Scale the X and Y axis (for example to use different units).
Right click on the query in the query list and choose .
Open the Query Display pulldown and change the X Scale and Y Scale to change the query multiplier, and the X and Y Offset to change the query additive values.
EnSight can perform queries at uniform points along the line tool, at nodes along a 1D part, or at uniform points along a spline. One-dimensional parts include model parts consisting of bar elements, 1D (Line) Clips, and particle traces.
At Line Tool Over Distance
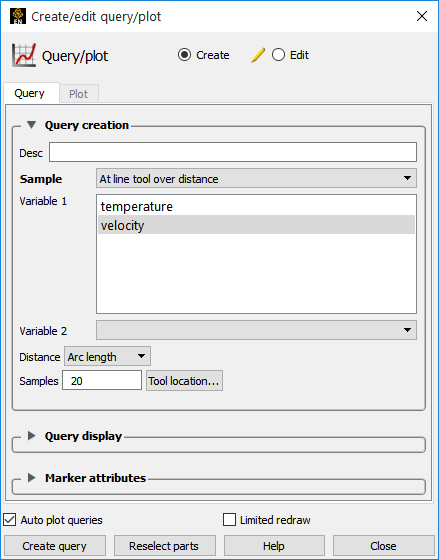
Select Sample as At Line Tool Over Distance.
Select the variable to query over the distance in Variable: 1. Leave Variable: 2 as None unless you want a scatter query of two different variables along the line tool.
Optionally, select the Distance option desired, number of points along the line, and modify the tool location if needed.
Click .
At 1D Part Over Distance
After selecting the part containing 1D elements in the Parts list and clicking the Query/Plot icon.
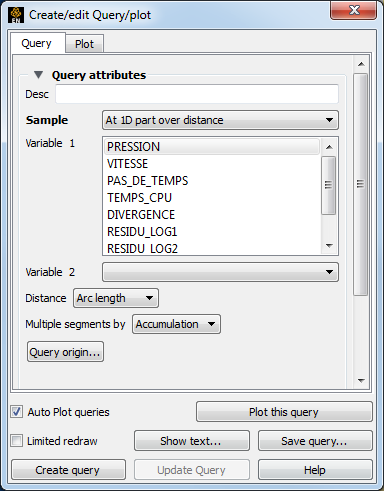
Select Sample as At 1D Part Over Distance.
Select one variable to query in Variable: 1.
Optionally modify Distance, Query origin... and Multiple segments by.
Click Create query.
The query will be created starting at the origin (or the lowest node ID number, or the first node in the connectivity list) and will automatically proceed by following the connectivity order. The order of the query cannot be changed, but it can be reversed in the plotter, if desired.
For the two over distance query types, the variable is plotted against the selected Distance metric. The node with the lowest node ID number (or nearest the selected origin) is queried first. The query then proceeds automatically from the first to the last according to the 1D part connectivity (this order cannot be changed). Since the nodes for 1D part over distance are not necessarily evenly spaced, the reported distance is one of the following:
|
Distance In Setting |
Reported Distance |
|
Arc Length |
The distance along the part from the first node to each subsequent node ( i.e. the sum of the 1D element lengths) |
|
X Arc Length |
The X coordinate value of each node accumulated from the start |
|
Y Arc Length |
The Y coordinate value of each node accumulated from the start |
|
Z Arc Length |
The Z coordinate value of each node accumulated from the start |
|
From Origin |
The distance from the origin |
|
X From Origin |
The X distance from the origin |
|
Y From Origin |
The Y distance from the origin |
|
Z From Origin |
The Z distance from the origin |
If the 1D part contains more than one set of contiguous 1D elements (such as a particle trace from a Line emitter), the resulting query will contain one plot entity for each set.
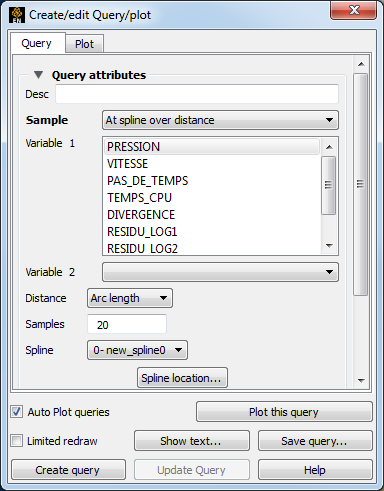
On a Spline Over Distance
After selecting the part to query in the Parts list and clicking the Query/Plot icon.
Select Sample as At spline over distance.
Select the Variable 1 to query along the spline.
Spline selects the spline to query.
Optionally, select the Distance option desired and the number of points along the spline.
Click Create query.
For transient dataset, EnSight can query the variable values over a range of time at a particular node, element (or specific IJK coordinate for structured data) or an arbitrary point. You can also search the minimum or maximum of a variable over all nodes over a time range.
At Node Over Time
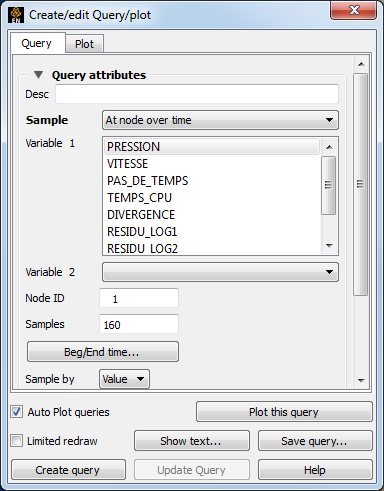
After selecting the part to query in the Parts list and clicking the Query/ Plot icon.
Select Sample as At Node Over Time.
Select one variable to query over time in Variable: 1. Leave Variable: 2 as None unless you want a scatter query of two different variables over time.
Enter the Node ID.
Optionally, change the number of Samples (defaults to number of time steps), and whether to sample by Value of FFT.
Click Create query.
At Element Over Time
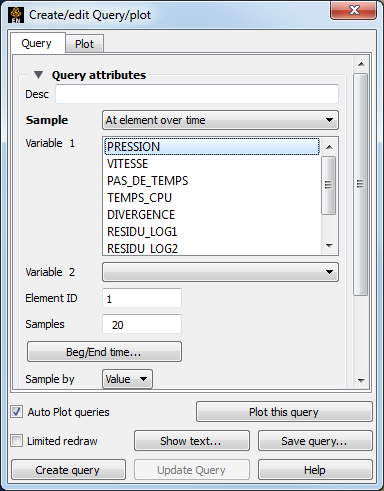
After selecting the part in the Parts list to query and clicking the Query/Plot icon.
Select Sample as At Element Over Time.
Select one per-element variable to query over time in Variable: 1. Leave Variable: 2 as None unless you want a scatter query of two different variables over time.
Enter the Element ID.
Optionally, change the number of Samples (defaults to number of time steps), and whether to sample by Value of FFT.
Click Create query.
At IJK Over Time
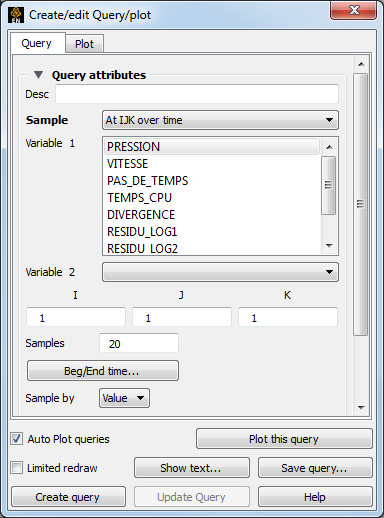
After selecting the part in the Parts list to query and clicking the Query/Plot icon.
Select Sample as At IJK Over Time.
Select one variable to query in Variable: 1. Leave Variable: 2 as None unless you want a scatter query of two different variables over time.
Enter I, J and K for the point.
Optionally, change the number of Samples (defaults to number of time steps), and whether to sample by Value of FFT.
Click Create query.
At XYZ Over Time
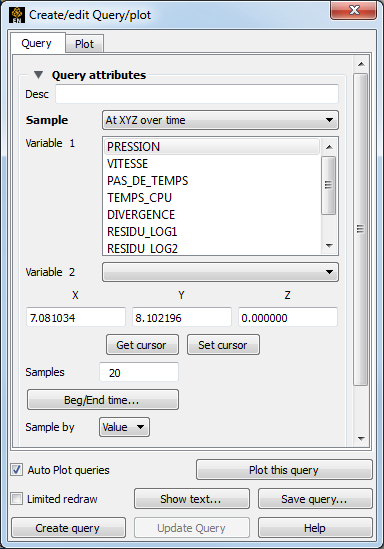
After selecting the part in the Parts list to query and clicking the Query/Plot icon.
Select Sample as At XYZ Over Time.
Select one variable to query over time in Variable: 1. Leave Variable: 2 as None unless you want a scatter query of two different variables over time.
Either type in the desired X, Y and Z location or place the cursor where desired in the model, either through picking, or other transformation methods and click the cursor button.
Optionally, change the number of Samples (defaults to number of time steps), and whether to sample by Value of FFT.
Click Create query.
At Minimum/Maximum Over Time
After selecting the part to query in the Parts list and clicking the Query/Plot icon.
Select Sample as At Minimum Over Time or At Maximum Over Time.
Select variable(s) to query over time in Variable: 1. Note: for max or min over time you can select multiple variables to query simultaneously over time for efficiency. Leave Variable: 2 as None unless you want a scatter query of two different variables over time.
Optionally, change the number of Samples (defaults to number of time steps), and whether to sample by Value of FFT.
Click Create query.
By Part Element Representation
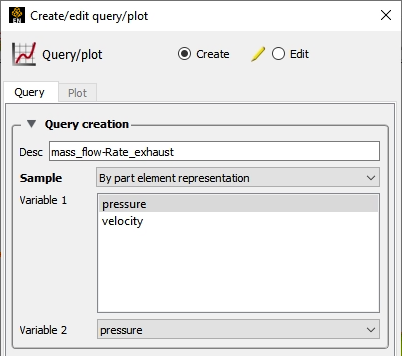
After selecting the part in the Parts list to query and clicking the Query/Plot icon.
Select Sample as .
Select one variable to query in Variable 1.
Select one variable to query in Variable 2. The variable chosen here must be of the same definition, i.e., if Variable 1 is a nodal variable Variable 2 must also be nodal.
Click .
By Scalar Value (integer match)
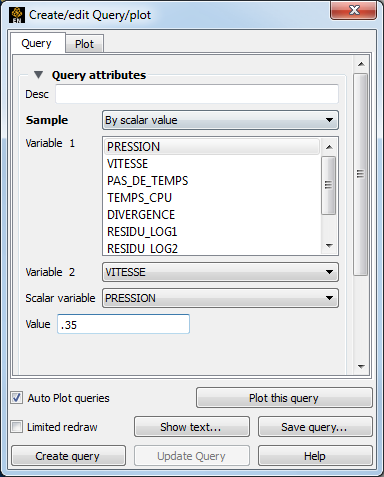
This query you select two variables - the first will be plotted on the y axis and the second is plotted on the x axis. Further, you specify another variable (can be the same as one of the two previous variables) and a value. The x and y variables will be extracted for all nodes/elements that integer match the value indicated (such that the int(value) exactly equals the int(value you enter)). It is best to view the results as a scatter plot.
After selecting the part in the Parts list to query and clicking the Query/Plot icon.
Select Sample as By Scalar Value.
Select the two variables you wish to form the query from.
Select the desired scalar variable and value.
Click Create query.
By Constant on Part Sweep
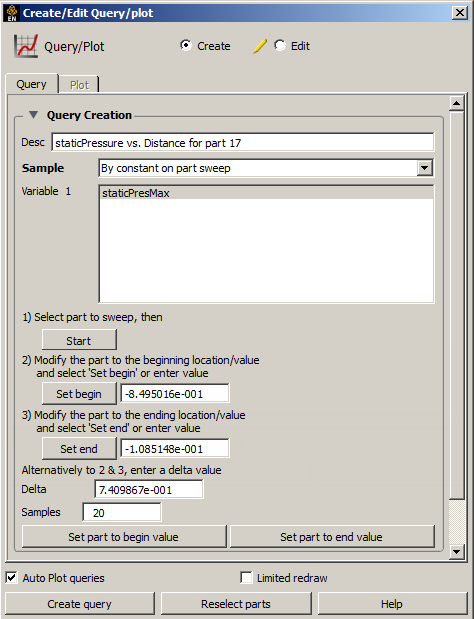
You can perform a query of a constant variable along a moving part at sampled locations.
After selecting the part in the Parts list to query and clicking the Query/Plot icon.
Select Sample as By constant on part sweep.
Select one or more listed constant variables.
Select a part to sweep. (in the main part list).
Select (At this point the dialog will become as shown).
Click-and-drag the part to the beginning location, and select , or just enter the beginning part location value.
Now interactively click-and-drag the part to the ending location, and select , or just enter the ending part location value.
Alternatively, you can just enter the Delta in place of the last two steps.
Enter the number of sample locations.
Select Create query.
Note: You can update the part to the beginning or ending values here.
A scatter query is a query of one variable against another.
Everything is done like a regular query except you select another variable in the Variable: 2 field, instead of leaving it as None.
You can perform a scaling of an existing query, or a scaling and algebraic addition of two queries, or an integration or differentiation of a query.
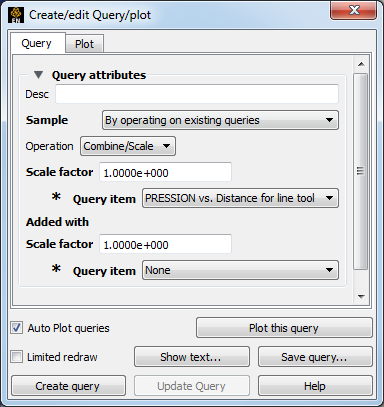
Select Sample as By Operating On Existing Queries.
Select the operation. (Combine/Scale, Integrate or Differentiate). For Combine/Scale (shown):
Select the Query item and the set the Scale Factor if you want to scale a single query - or - Select both Query items and set both Scale Factors if you want to scale and add algebraically.
Click Create query.
Note: If integrate or differentiate is chosen, you will only need to choose the query to operate on.
You can import previously created and saved (or externally generated) EnSight queries or Dytran time history (.ths) files.
Read From An External File
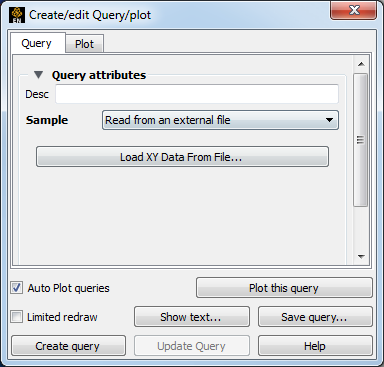
Select Sample as .
Click the button to open the File Selection dialog, and select any previously saved EnSight XY data file or a Dytran .ths file.
Note: Depending on the version of the Dytran reader you are using (reader version 2.05 or later is needed), the Dytran xy data may be loaded automatically for you, making this option unnecessary for Dytran data.
Read from Server File
Traditionally, you could ask the server for any queries that it knows about. Some data formats (accessed by user-defined readers) have such. If any are available, they would show up in the list of Queries. In version 10, such queries get loaded automatically, so this option is not really needed and may do nothing.
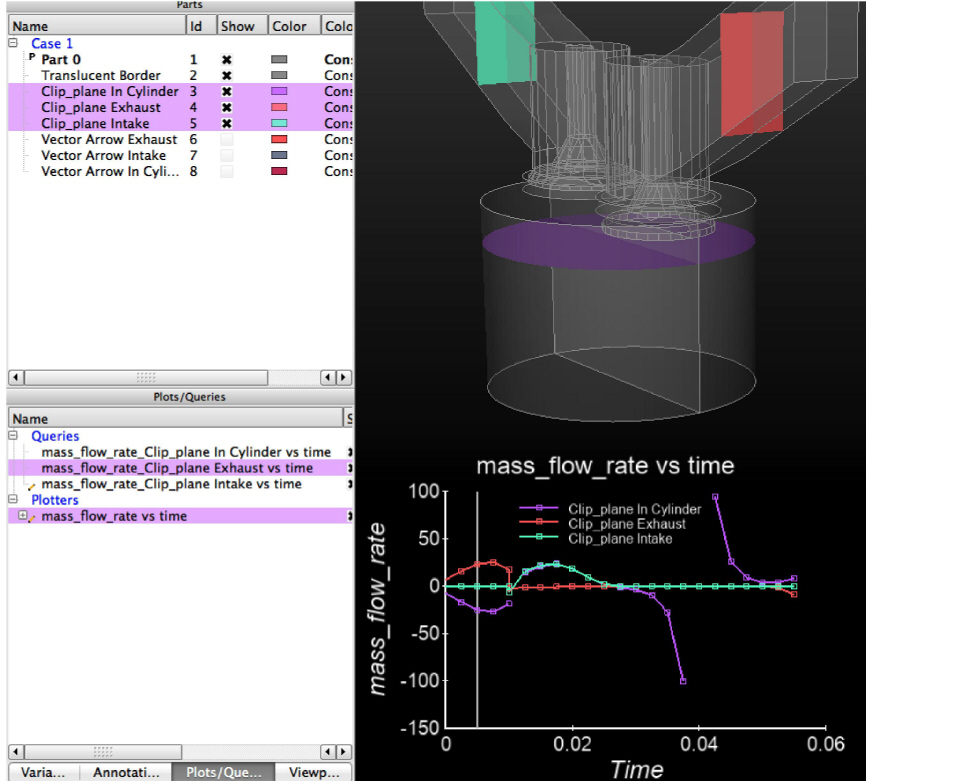
Once Queries exist, they can be easily plotted in a new plotter in EnSight, or if an existing plotter of the correct type exists, they can be added to the existing plotter.
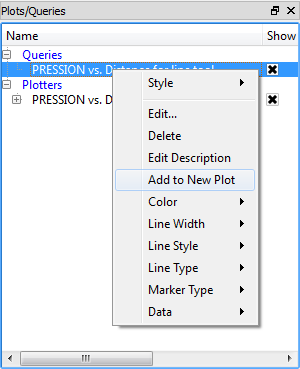
Right click on the query to be plotted.
Select Add to New Plot from the pulldown to create a new plotter showing the selected query.
If you want to plot the query on an existing plotter:
Click and drag the query over the plotter and release the mouse button. Similarly, you can click and drag the query to the graphics window and release the mouse button on top of the axis system of an existing plotter.
Drag the query and drop it onto the plotter.